> ## Documentation Index
> Fetch the complete documentation index at: https://usepike.com/docs/llms.txt
> Use this file to discover all available pages before exploring further.
# Project finance
> Track invoices, profitability, and financial metrics for a project.
The project finance view gives you real-time tracking and insights in the financial health of the project.
 ## Financial Overview
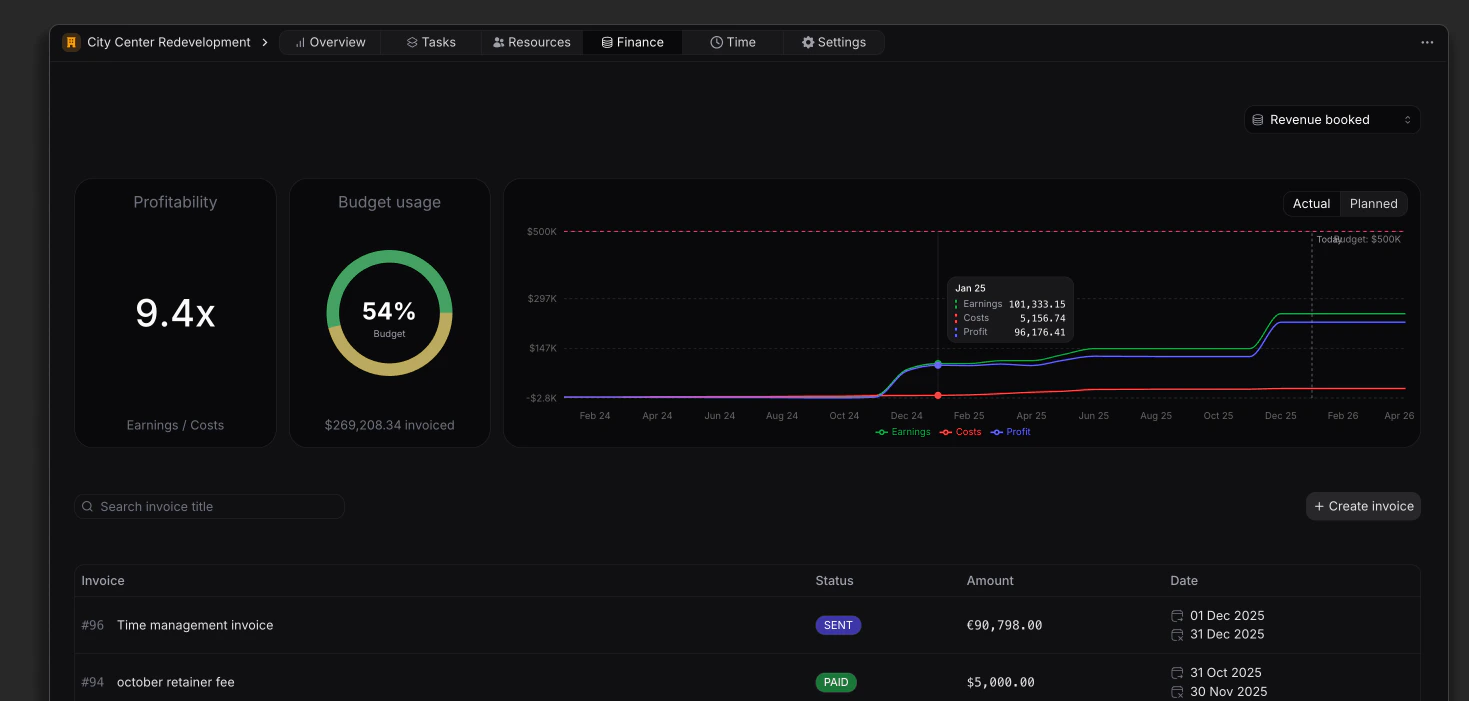
At the top of the Finance view, you get an instant understanding of how your project is performing financially.
Before diving into the metrics, it is important to understand that the Finance view can be toggled between two perspectives using the selector in the top right corner:
* **Billable time**\
Earnings are calculated based on logged hours × billable rates
* **Revenue booked**\
Earnings are based on invoices created for the project
This selection impacts how earnings, profitability, and charts are calculated throughout the view.
## Profitability
The Profitability card shows the **earnings ratio of the project**, giving you a quick indication of how efficiently the project is generating value.
By hovering over the card, a detailed breakdown expands showing:
* Earnings
* Costs
* Profit
**Profit = Earnings − Costs**
Billable time vs revenue booked, planned profitability, filters, and cost
breakdown rules.
### Earnings
Earnings are calculated based on the selected view:
* In **Billable time**, earnings = logged hours × billable rate
* In **Revenue booked**, earnings = total value of invoices created
### Costs
Costs are primarily driven by:
* **Labour**\
Calculated as: member hourly cost × logged hours
* **Expenses**\
Logged expenses assigned to the project, grouped by category
### Cost breakdown modal
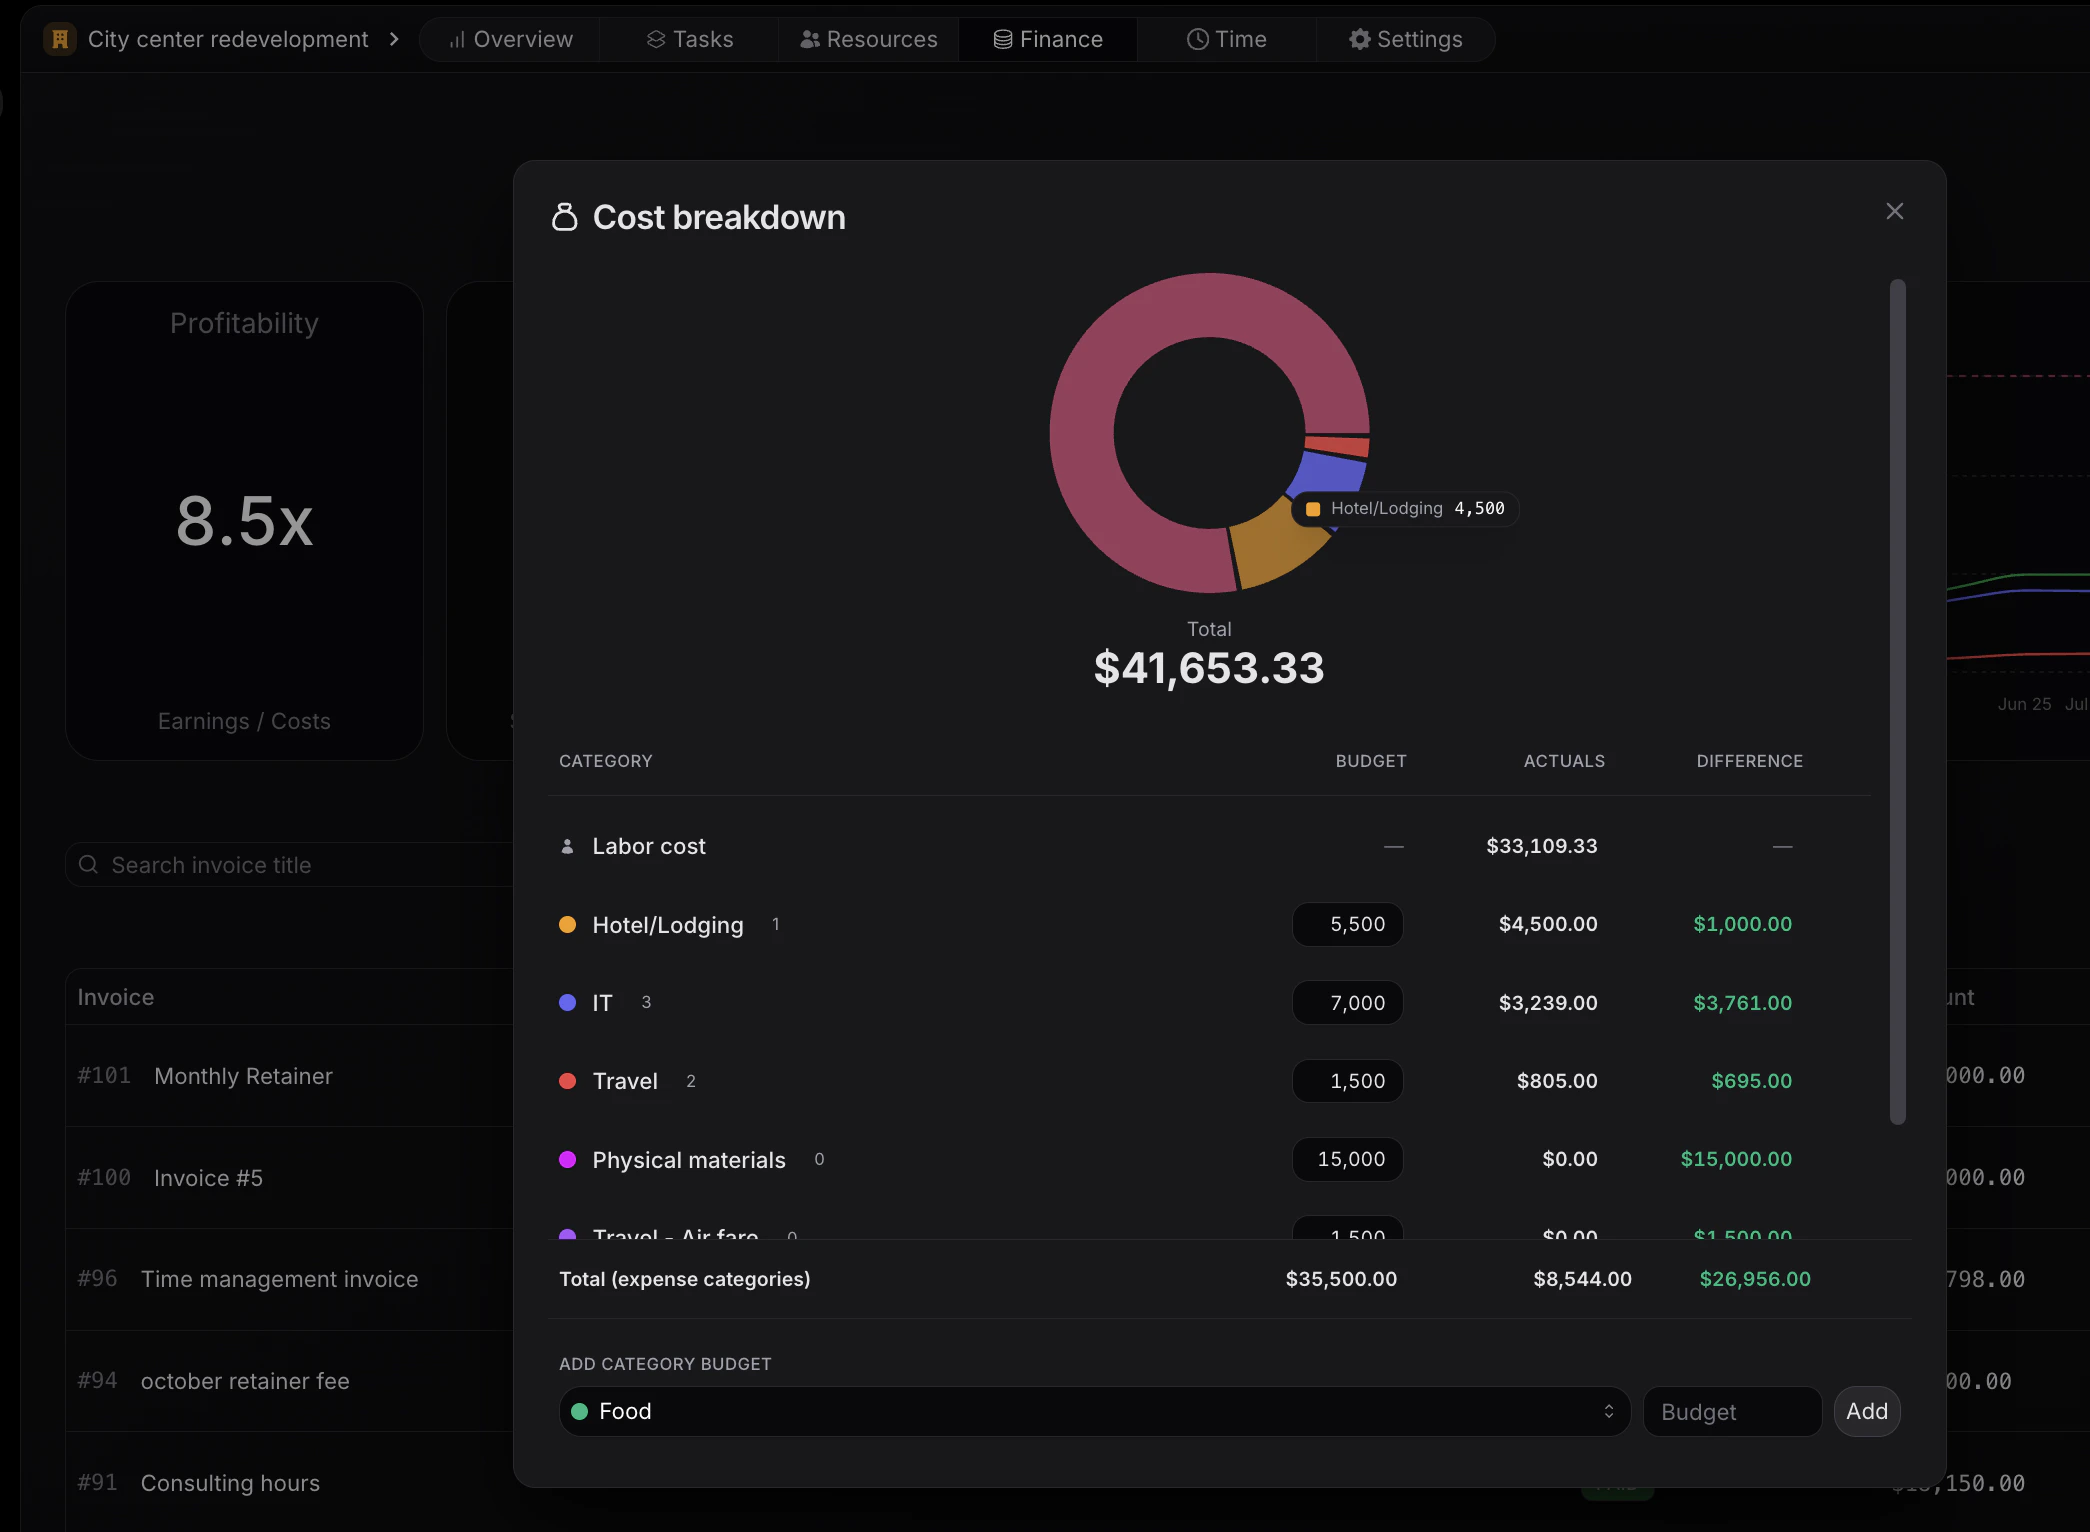
Clicking on **Costs** opens a detailed modal with a full breakdown.
Inside the modal:
* A **pie chart** shows the distribution of actual costs across:
* Labour
* Expense categories
* Below the chart, you can define **cost budgets per expense category**\
These categories are configured in:\
`Log → Expenses → Settings`
* Actual expenses are tracked against these budgets in real time, showing:
* Remaining budget
* Or overspend (positive or negative balance)
This gives full visibility into where money is being spent and where projects may be going off track.
## Financial Overview
At the top of the Finance view, you get an instant understanding of how your project is performing financially.
Before diving into the metrics, it is important to understand that the Finance view can be toggled between two perspectives using the selector in the top right corner:
* **Billable time**\
Earnings are calculated based on logged hours × billable rates
* **Revenue booked**\
Earnings are based on invoices created for the project
This selection impacts how earnings, profitability, and charts are calculated throughout the view.
## Profitability
The Profitability card shows the **earnings ratio of the project**, giving you a quick indication of how efficiently the project is generating value.
By hovering over the card, a detailed breakdown expands showing:
* Earnings
* Costs
* Profit
**Profit = Earnings − Costs**
Billable time vs revenue booked, planned profitability, filters, and cost
breakdown rules.
### Earnings
Earnings are calculated based on the selected view:
* In **Billable time**, earnings = logged hours × billable rate
* In **Revenue booked**, earnings = total value of invoices created
### Costs
Costs are primarily driven by:
* **Labour**\
Calculated as: member hourly cost × logged hours
* **Expenses**\
Logged expenses assigned to the project, grouped by category
### Cost breakdown modal
Clicking on **Costs** opens a detailed modal with a full breakdown.
Inside the modal:
* A **pie chart** shows the distribution of actual costs across:
* Labour
* Expense categories
* Below the chart, you can define **cost budgets per expense category**\
These categories are configured in:\
`Log → Expenses → Settings`
* Actual expenses are tracked against these budgets in real time, showing:
* Remaining budget
* Or overspend (positive or negative balance)
This gives full visibility into where money is being spent and where projects may be going off track.
 ## Budget usage
The Budget usage card shows how much of the project budget has been consumed.
This is calculated based on:
* The **project budget**
* The **invoices created for the project**
It provides a quick percentage view of how much of the budget has been used.
This helps answer:
* How far are we through the budget?
* Are we over or under billing relative to the plan?
## Financial chart
The chart visualises how the project evolves over time.
It shows three key metrics:
* **Earnings** (green)
* **Costs** (red)
* **Profit** (blue)
The chart updates dynamically based on the selected view:
* **Billable time** → earnings based on logged time
* **Revenue booked** → earnings based on invoices
### Planned vs Actual
You can toggle between:
* **Actual**\
Shows real performance based on logged time, costs, and invoices
* **Planned**\
Shows expected performance based on the defined budget
### Budget line
A horizontal line indicates the total project budget.
This allows you to quickly see:
* When earnings approach or exceed the budget
* Whether costs are aligned with expectations
* How profit evolves relative to the budget over time
## Invoice Management
Efficiently manage invoices related to the project, with the ability to search for specific invoices by title.
## Invoice List
The Finance view includes a list that displays all invoices associated with the project, providing essential information at a glance:
* **Invoice Number**\
A unique identifier for each invoice
* **Title**\
Provides context for the billed services or products
* **Status**\
Draft, Sent, Paid, or Overdue
* **Amount**\
Total value of the invoice
* **Date**\
When the invoice was issued
Additionally, the invoice list contains a **+ Create Invoice** button that will prefill your workspace, customer, and project details.
The project will automatically be set to the one you are currently viewing.
Learn more about creating invoices:
Discover how to create and manage invoices effectively.
## Budget usage
The Budget usage card shows how much of the project budget has been consumed.
This is calculated based on:
* The **project budget**
* The **invoices created for the project**
It provides a quick percentage view of how much of the budget has been used.
This helps answer:
* How far are we through the budget?
* Are we over or under billing relative to the plan?
## Financial chart
The chart visualises how the project evolves over time.
It shows three key metrics:
* **Earnings** (green)
* **Costs** (red)
* **Profit** (blue)
The chart updates dynamically based on the selected view:
* **Billable time** → earnings based on logged time
* **Revenue booked** → earnings based on invoices
### Planned vs Actual
You can toggle between:
* **Actual**\
Shows real performance based on logged time, costs, and invoices
* **Planned**\
Shows expected performance based on the defined budget
### Budget line
A horizontal line indicates the total project budget.
This allows you to quickly see:
* When earnings approach or exceed the budget
* Whether costs are aligned with expectations
* How profit evolves relative to the budget over time
## Invoice Management
Efficiently manage invoices related to the project, with the ability to search for specific invoices by title.
## Invoice List
The Finance view includes a list that displays all invoices associated with the project, providing essential information at a glance:
* **Invoice Number**\
A unique identifier for each invoice
* **Title**\
Provides context for the billed services or products
* **Status**\
Draft, Sent, Paid, or Overdue
* **Amount**\
Total value of the invoice
* **Date**\
When the invoice was issued
Additionally, the invoice list contains a **+ Create Invoice** button that will prefill your workspace, customer, and project details.
The project will automatically be set to the one you are currently viewing.
Learn more about creating invoices:
Discover how to create and manage invoices effectively.