
Resources
Project timeline and overview of resource allocation.
Overview
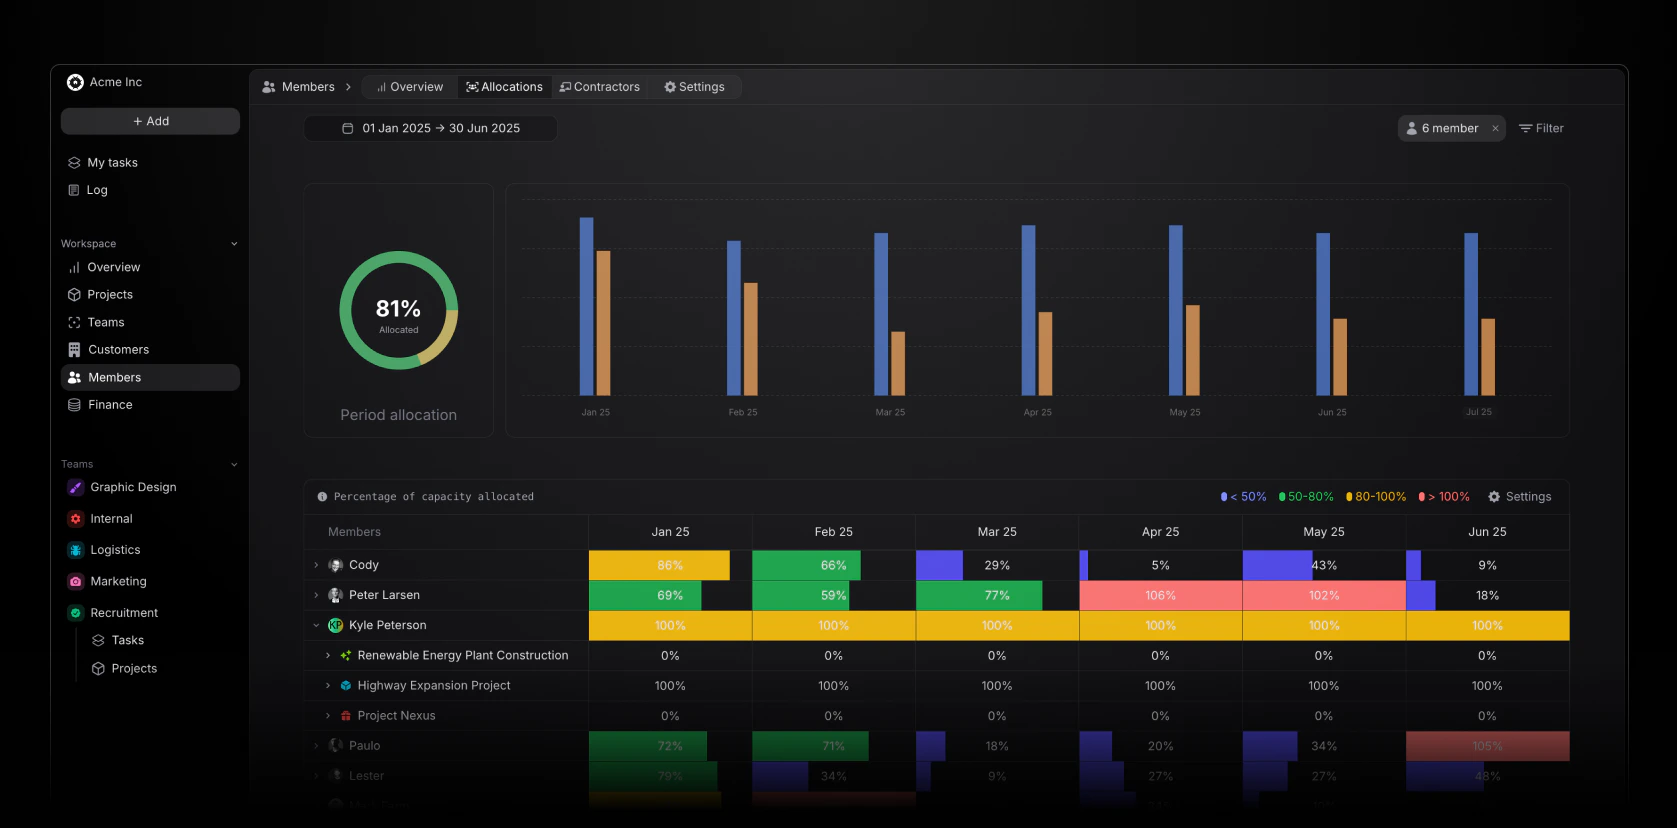
In Members → Resource allocation, admins and managers can see a real-time capacity overview for everyone in the workspace. Each team also has an Allocations tab (team header) that shows the same heatmap, timeline, charts, and member list, scoped to that team’s members only. Filters and view switching work the same way as the workspace page. The page includes:- A pie chart and bar chart of total booked hours versus available capacity (respects your filters).
- A timeline of member allocations across projects over time, where you can adjust or move bookings (respects your filters).
- A list of members with booked versus available hours (respects your filters). Expand a member to see projects and tasks their bookings apply to.
Charts and member list
Timeline
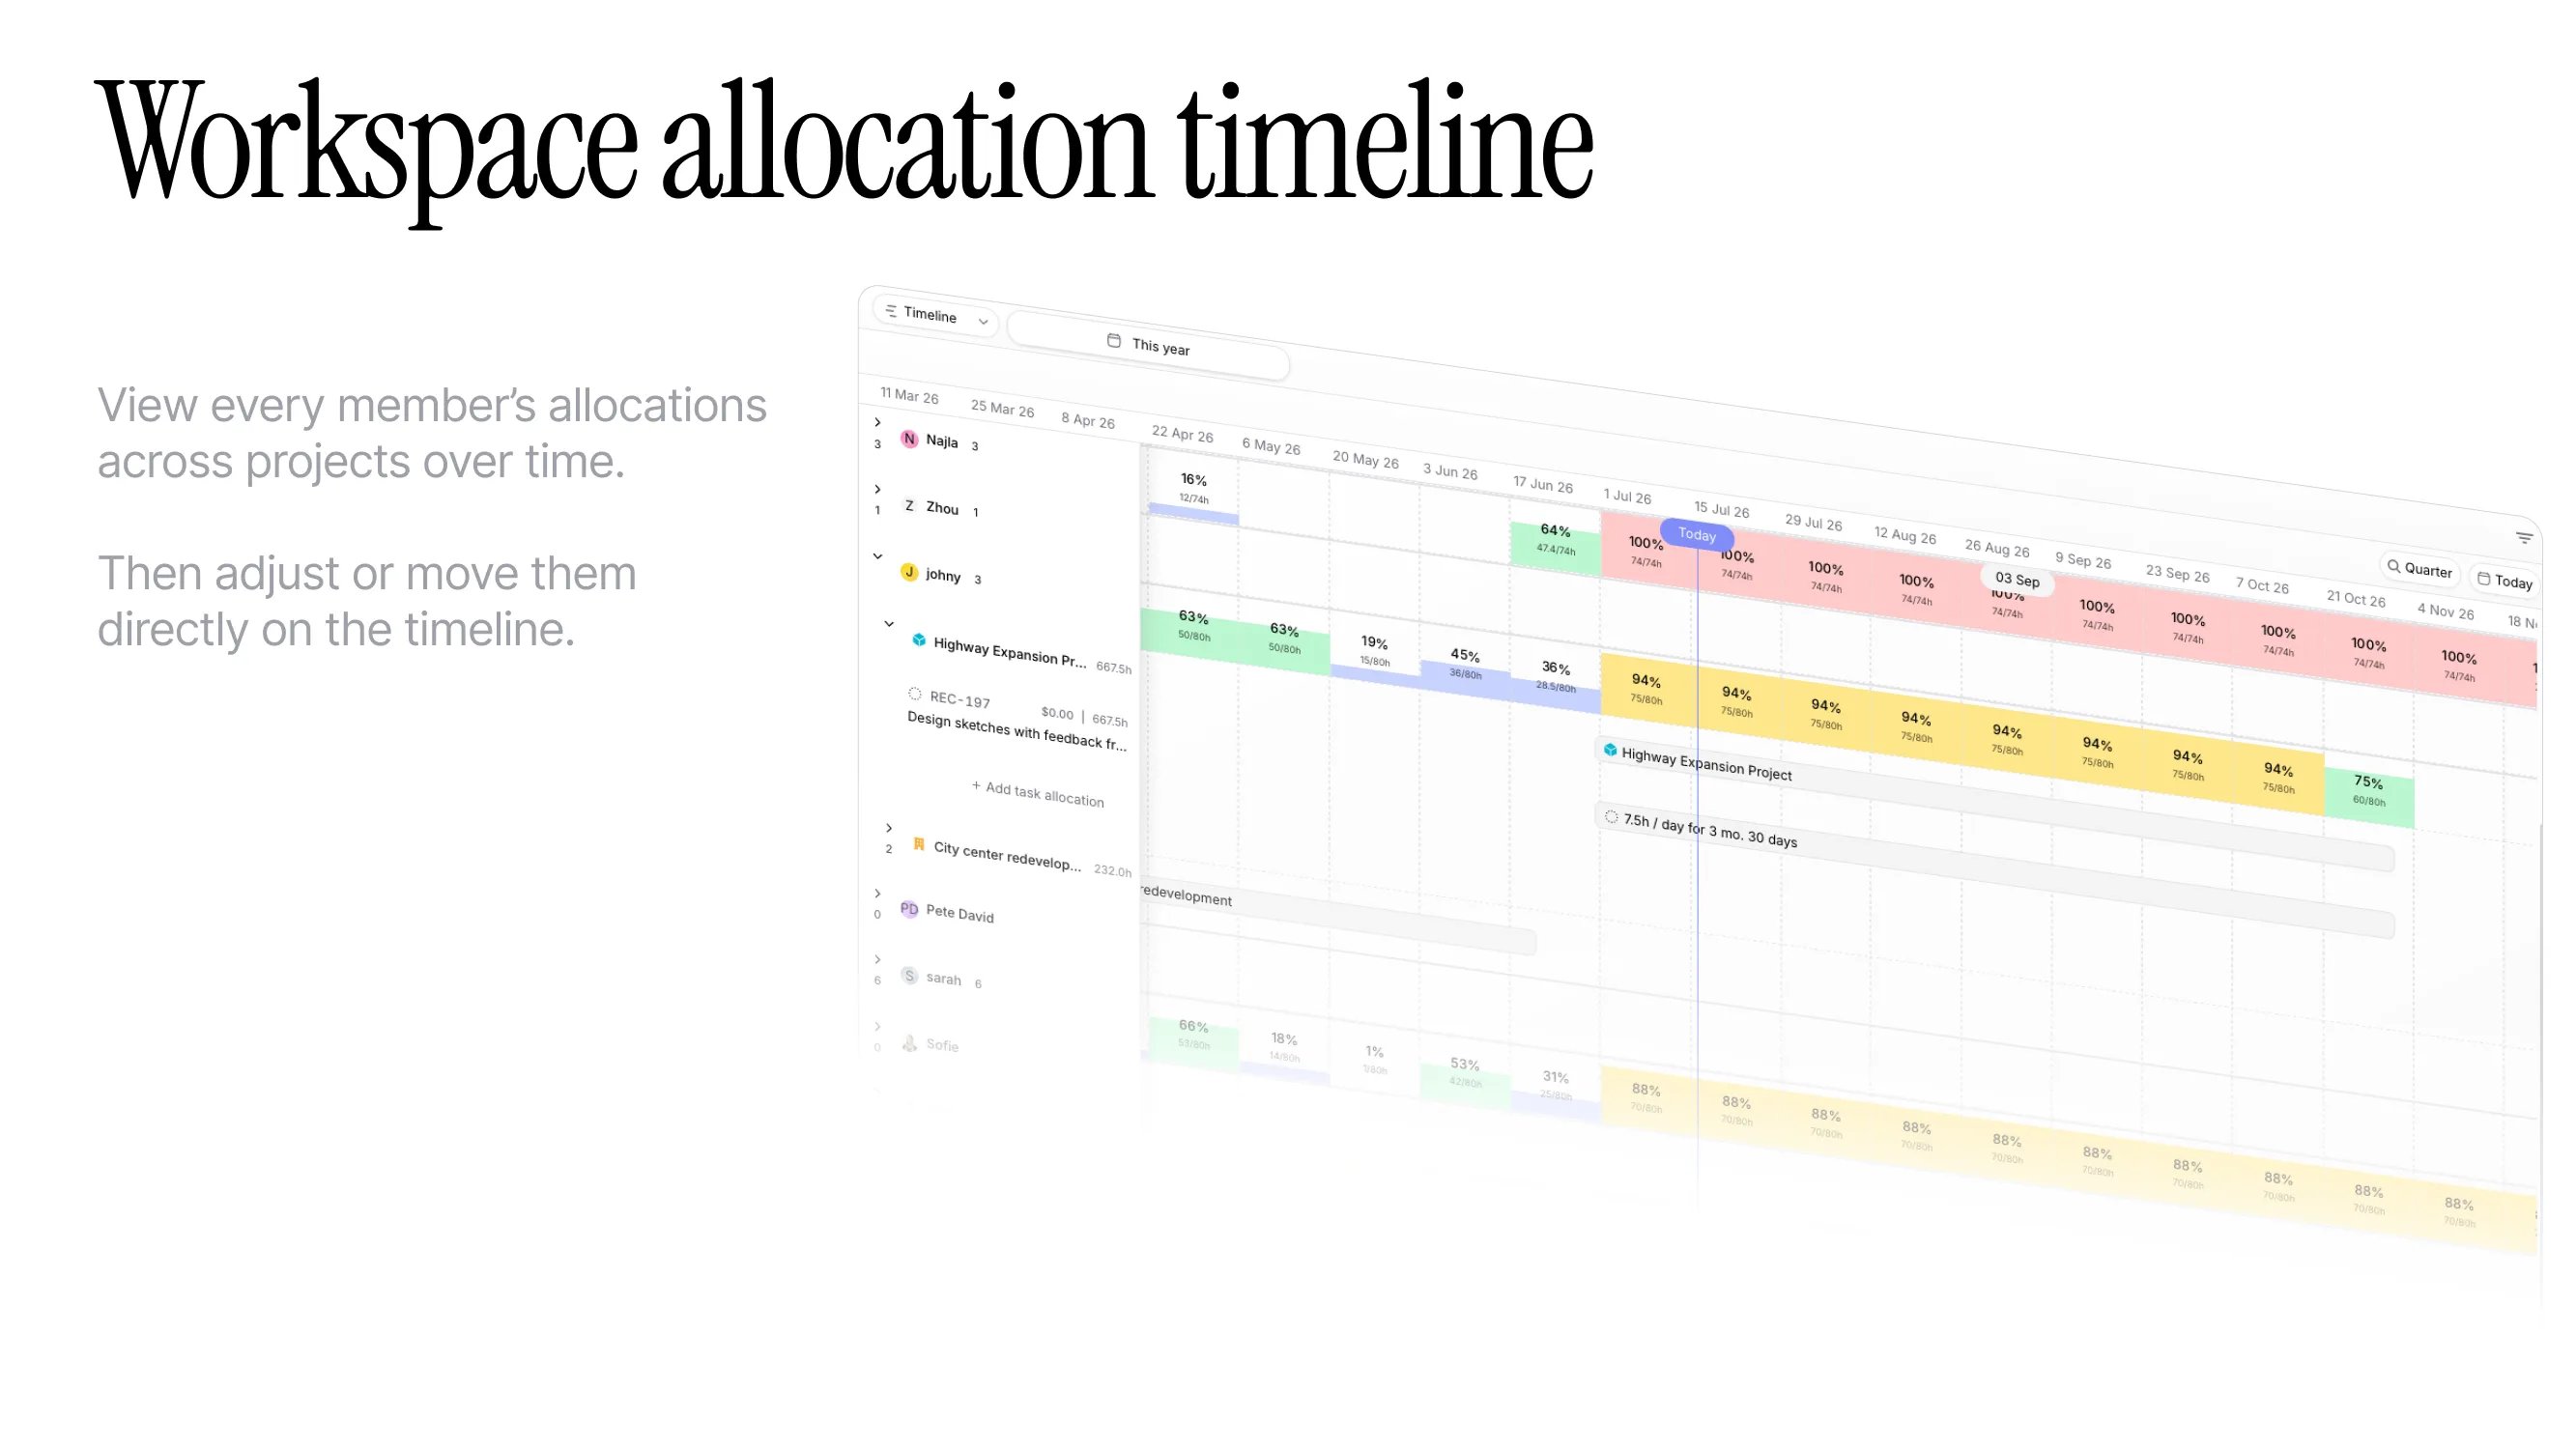
- See who is booked where across the date range
- Adjust or move allocations directly on the timeline
- Apply the same filters as the capacity heatmap view so proposed versus confirmed work, teams, skills, and other cuts stay consistent. The utilization row under each member uses the same stacked confirmed / proposed fill as the heatmap.
Capacity heatmap
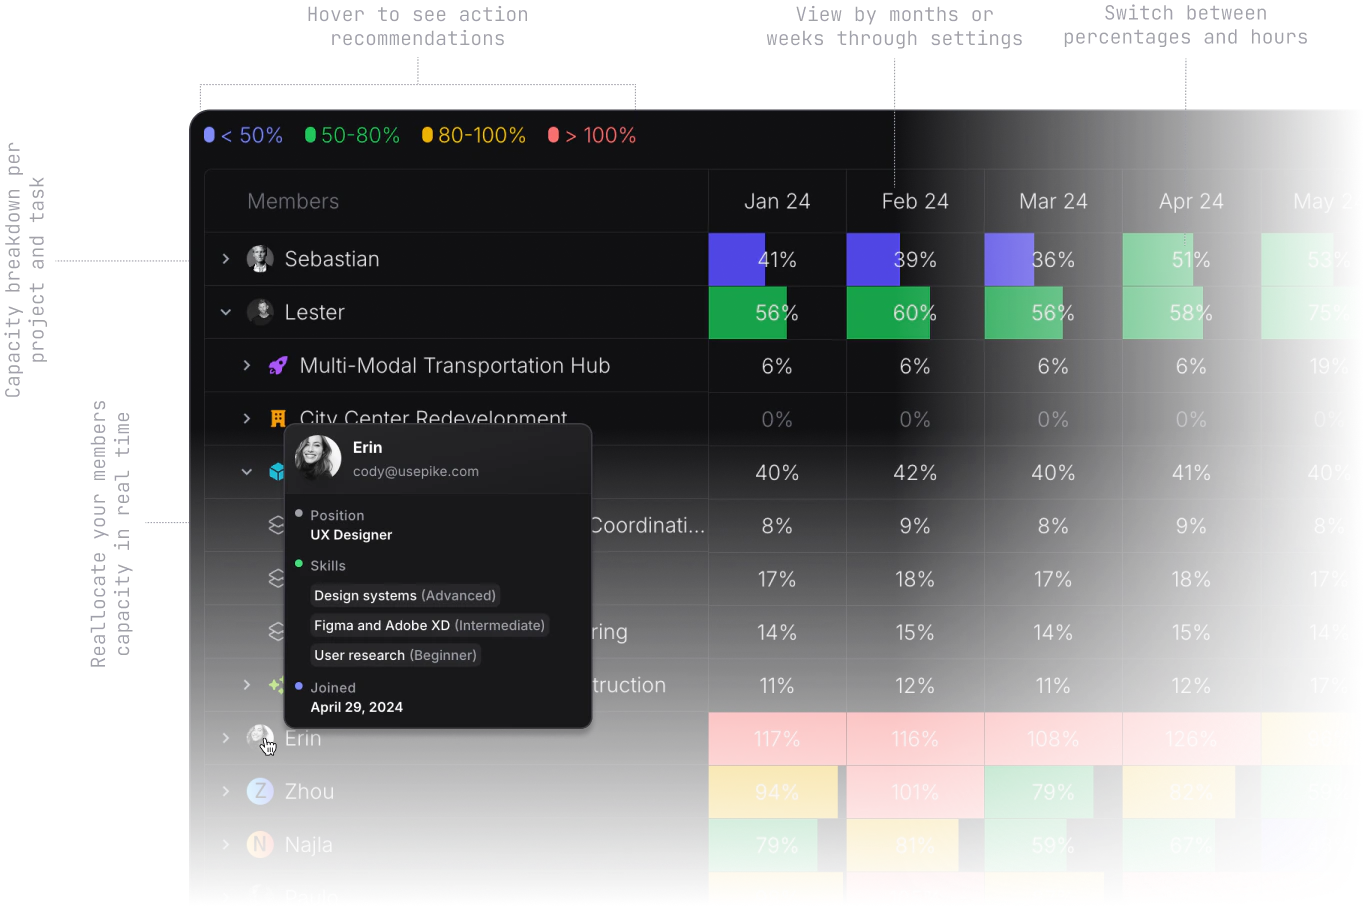
- Solid fill is hours on confirmed projects.
- Hatched overlay is hours on proposed projects, in the same color as the solid fill.
- Color bands follow total utilization (confirmed plus proposed).
- Hover a cell for total, confirmed, and proposed amounts.
Filters
You can filter the resource allocation page by:- Time period
- Project(s)
- Proposed / Confirmed - leave both selected (or neither) to stack confirmed and proposed demand. Pick only Confirmed or only Proposed when you want to isolate one pipeline.
- Member(s)
- Team(s)
- Position(s)
- Skill(s)
Settings
In the members table (settings), you can choose from the following ways to show allocations and capacity:- Weekly impact (instead of the default monthly)
- Show remaining hours available to be booked (instead of the default hours already booked)
- Show booking and capacity in percentage or hours
How available and allocated hours work
You choose a start and end date. You can optionally narrow the people (for example by team, project, role, or skills). The system then walks one day at a time through that range for each included person.Available hours (capacity that day)
For each calendar day, the system asks how much that person could work that day if nothing else blocked them.- It uses their employment contract and the hours per week on the version of the contract that already applied by that day - the latest one whose start date is on or before that day. If there is no such contract, capacity is zero.
- It assumes a Monday-Friday work pattern: weekends count as zero available hours.
- It spreads weekly hours evenly across those five weekdays (each weekday gets one-fifth of the weekly hours, before time off).
- If the person has time off that covers that day and it is not rejected, that whole weekday is treated as fully off: available hours for that day become zero. By default that includes both pending and approved requests; you can switch to only approved time off via the query flag the API exposes.
Allocated hours (planned work on tasks)
For each day, the system also adds up how many hours they are planned on tasks:- It only considers tasks they are assigned to that are not cancelled and not marked duplicate.
- Planning comes from task allocations: for a given period, how many minutes per weekday (Monday through Friday) they are supposed to spend on that task. Those minutes are turned into hours and summed for that day.
- Tasks without allocations contribute nothing to allocated hours.
- Work is grouped under projects (tasks with no project go under a generic no project bucket).
- Hours on proposed projects are kept separate from hours on confirmed projects. The heatmap stacks them; totals and color thresholds use confirmed plus proposed unless you filter to one side.
How it is summarized
For each person, for each day in the range, you get:- Available hours - capacity that day (contract-based, weekdays only, minus full-day time off as above).
- Allocated hours - planned hours from their task allocations that day, split into confirmed and proposed.