
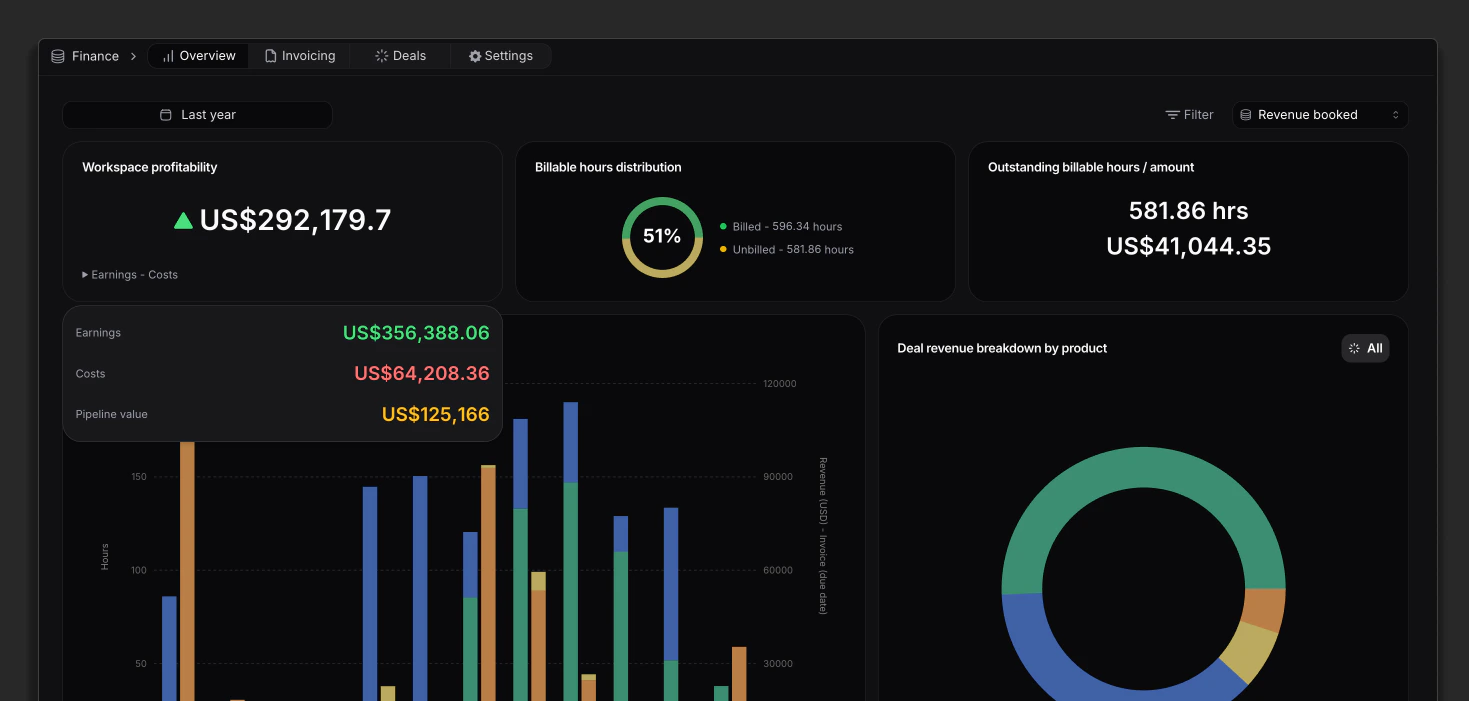
Summary cards
These cards use one definition of earned revenue: recognized. They are not invoiced totals, and they are not billing rate or cost per hour sold.
WIP and Deferred are two sides of the same gap. Click a card for the project breakdown.
How each project earns recognized revenue is set on the project. See Revenue recognition for methods, overrides, and the monthly grid.
Project finance
The same six cards on one project, plus budget usage and the monthly table.
Revenue recognition
Time %, Worked, Manual, and month-level overrides.
Filters
The filter bar at the top scopes every card and chart:Profitability
The Profitability card and cumulative chart use the same earnings and cost as the cards: recognized versus cost of delivery. Hover the card for the breakdown. The cumulative chart also plots planned profitability from resource allocations, so you can compare the schedule to what has been earned and spent. Planned is a comparison line, not a second mode for the six cards.Profitability
How cost is built, planned comparison, and what the customer finance toggle
does.
Recognized versus invoiced
The second chart plots recognized and invoiced over the selected range. The gap in any month is the same WIP or Deferred idea as the cards, rolled up across projects.Pipeline
Below the finance charts, Pipeline shows open deals by stage and expected close date. Deal value is not recognized or invoiced revenue.Rates and other metrics
Billing rate, cost per hour sold, and hours sold are dashboard metrics and optional projects list columns. They are not a seventh Finance Overview card.Metric catalogue
Chart hours sold, billing rate, cost per hour sold, and the other workspace
metrics.