Real-time project profitability: how to see it live
Share
"Which of our projects are actually profitable right now?" is a question a lot of agency owners can't answer without waiting for the books to close. By the time month-end reporting says a project ran at 15% margin instead of the 40% it was priced at, the hours are already logged and the budget is already spent. This guide covers what it takes to see profitability while a project is still live, not after it.
What real-time project profitability means
Real-time project profitability is reading a project's margin from time and cost data as it's logged, rather than from a report compiled after the invoice goes out. Instead of asking "how did this project do," the question becomes "how is this project doing right now, and does it need attention this week." The mechanics are the same as tracking project profitability at any cadence: revenue earned minus direct delivery costs. What changes is the freshness of the inputs and how often you look.
A project that is 60% complete on a $50,000 contract has earned $30,000. If direct costs to that point sit at $19,000, the project is running at 36.7% margin. That number is only "real time" if it reflects today's logged hours and today's cost rates, not a spreadsheet someone updated three weeks ago.
Why month-end reporting is too late
Month-end reporting shows what already happened, which means any decision it triggers (cutting scope, adjusting resourcing, having a pricing conversation with the client) arrives after most of the budget is already spent. A project that slips from 40% to 15% margin over six weeks of delivery gives you very little room to fix it if you only see the number once the project closes.
The gap gets worse on longer engagements. A three-month project reviewed only at month-end has burned a third of its budget before the first profitability read even happens. By the time a pattern shows up in the aggregate P&L, the projects that caused it are often already finished, and the lesson only helps the next proposal, not the one currently bleeding margin.
Take two projects priced at the same 40% target margin. One is tracked weekly and drifts to 30% margin in week three, gets flagged, and a scope conversation with the client brings it back to 35% by close. The other is only checked at month-end, drifts the same way, and closes at 22% because nobody caught it until the invoice went out. Same starting price, same kind of slip, very different outcome, because one team had a decision window and the other didn't.
What live margin visibility requires
Live visibility needs one thing a lagging report doesn't: time and cost data that flows into the margin calculation as it's created, not on a batch schedule. Three pieces have to be connected for that to work.
Time logged against the project has to carry a cost rate the moment it's entered, not get reconciled against payroll weeks later. Project budgets have to update as costs accrue, so "percent of budget spent" is always current rather than a number from the last time someone opened the spreadsheet. And the margin calculation itself, revenue earned minus costs incurred, has to run continuously instead of as a periodic export.
Miss any one of those and the "real-time" number is really a same-week estimate at best. A spreadsheet can approximate this if someone updates it daily without fail, but that's a fragile process to depend on, and it's usually the first thing to slip when the team gets busy, which is exactly when an accurate number matters most.
There's a setup step this depends on: every person allocated to a project needs a cost rate attached before work starts, not backfilled later. Without that rate sitting behind each hour logged, there's no denominator to calculate margin against in the first place, live or otherwise. Agencies that skip this step usually end up bolting cost rates on after the fact, which means the "real-time" number for the first few weeks of any project is really a guess dressed up as data.
The leading signals that show margin is slipping
A handful of signals show up while a project is still running, well before the closing invoice would reveal the same problem:
- Hours logged are running ahead of percent-complete. A project 40% through its timeline that has already consumed 55% of its budgeted hours is heading for a margin miss unless something changes.
- A senior person is logging time against tasks priced at a junior rate. This one is easy to miss without resource-level cost visibility, and it compounds fast on longer projects.
- Unbilled scope additions are accumulating. Extra rounds of revision or new requests that haven't gone through a change order add cost with no matching revenue.
- The gap between earned revenue and cost-to-date is narrowing week over week, even if the project still shows a positive margin today.
- Two or more projects are drawing on the same limited pool of a specific skill, which shows up as a scheduling squeeze on paper before it shows up as a margin problem on the invoice.
None of these require the project to be finished to act on. Each one is a decision point: renegotiate scope, reallocate a resource, or raise a change order, while there's still budget left to protect.
Reading the numbers: what to watch and when to act
| Metric | What it tells you | When to act |
|---|---|---|
| Percent of budget spent vs percent complete | Whether cost is outpacing delivery progress | Spent is more than 10 points ahead of complete |
| Current margin vs target margin | Whether the project is tracking to plan | Margin trails target by more than 5 points |
| Hours by role vs rate card | Whether senior time is covering junior-rated work | Any senior hours logged against junior-rated tasks |
| Unbilled scope items | Cost added with no corresponding revenue | Any unbilled item sits open more than a few days |
A weekly look at these four numbers, per active project, catches most margin problems early enough to still have options. Waiting for month-end collapses all four into one lagging number that arrives after the decision window has closed.
This weekly check is a subset of a broader profitability cadence, not a replacement for it. Firm-level reviews, benchmarking against target margins by project type, and post-project retrospectives still matter; they just answer a different question than "is this specific project okay this week." Real-time visibility is what lets you act during delivery. The slower cadence is what improves how you price and staff the next project.
Where Pike fits
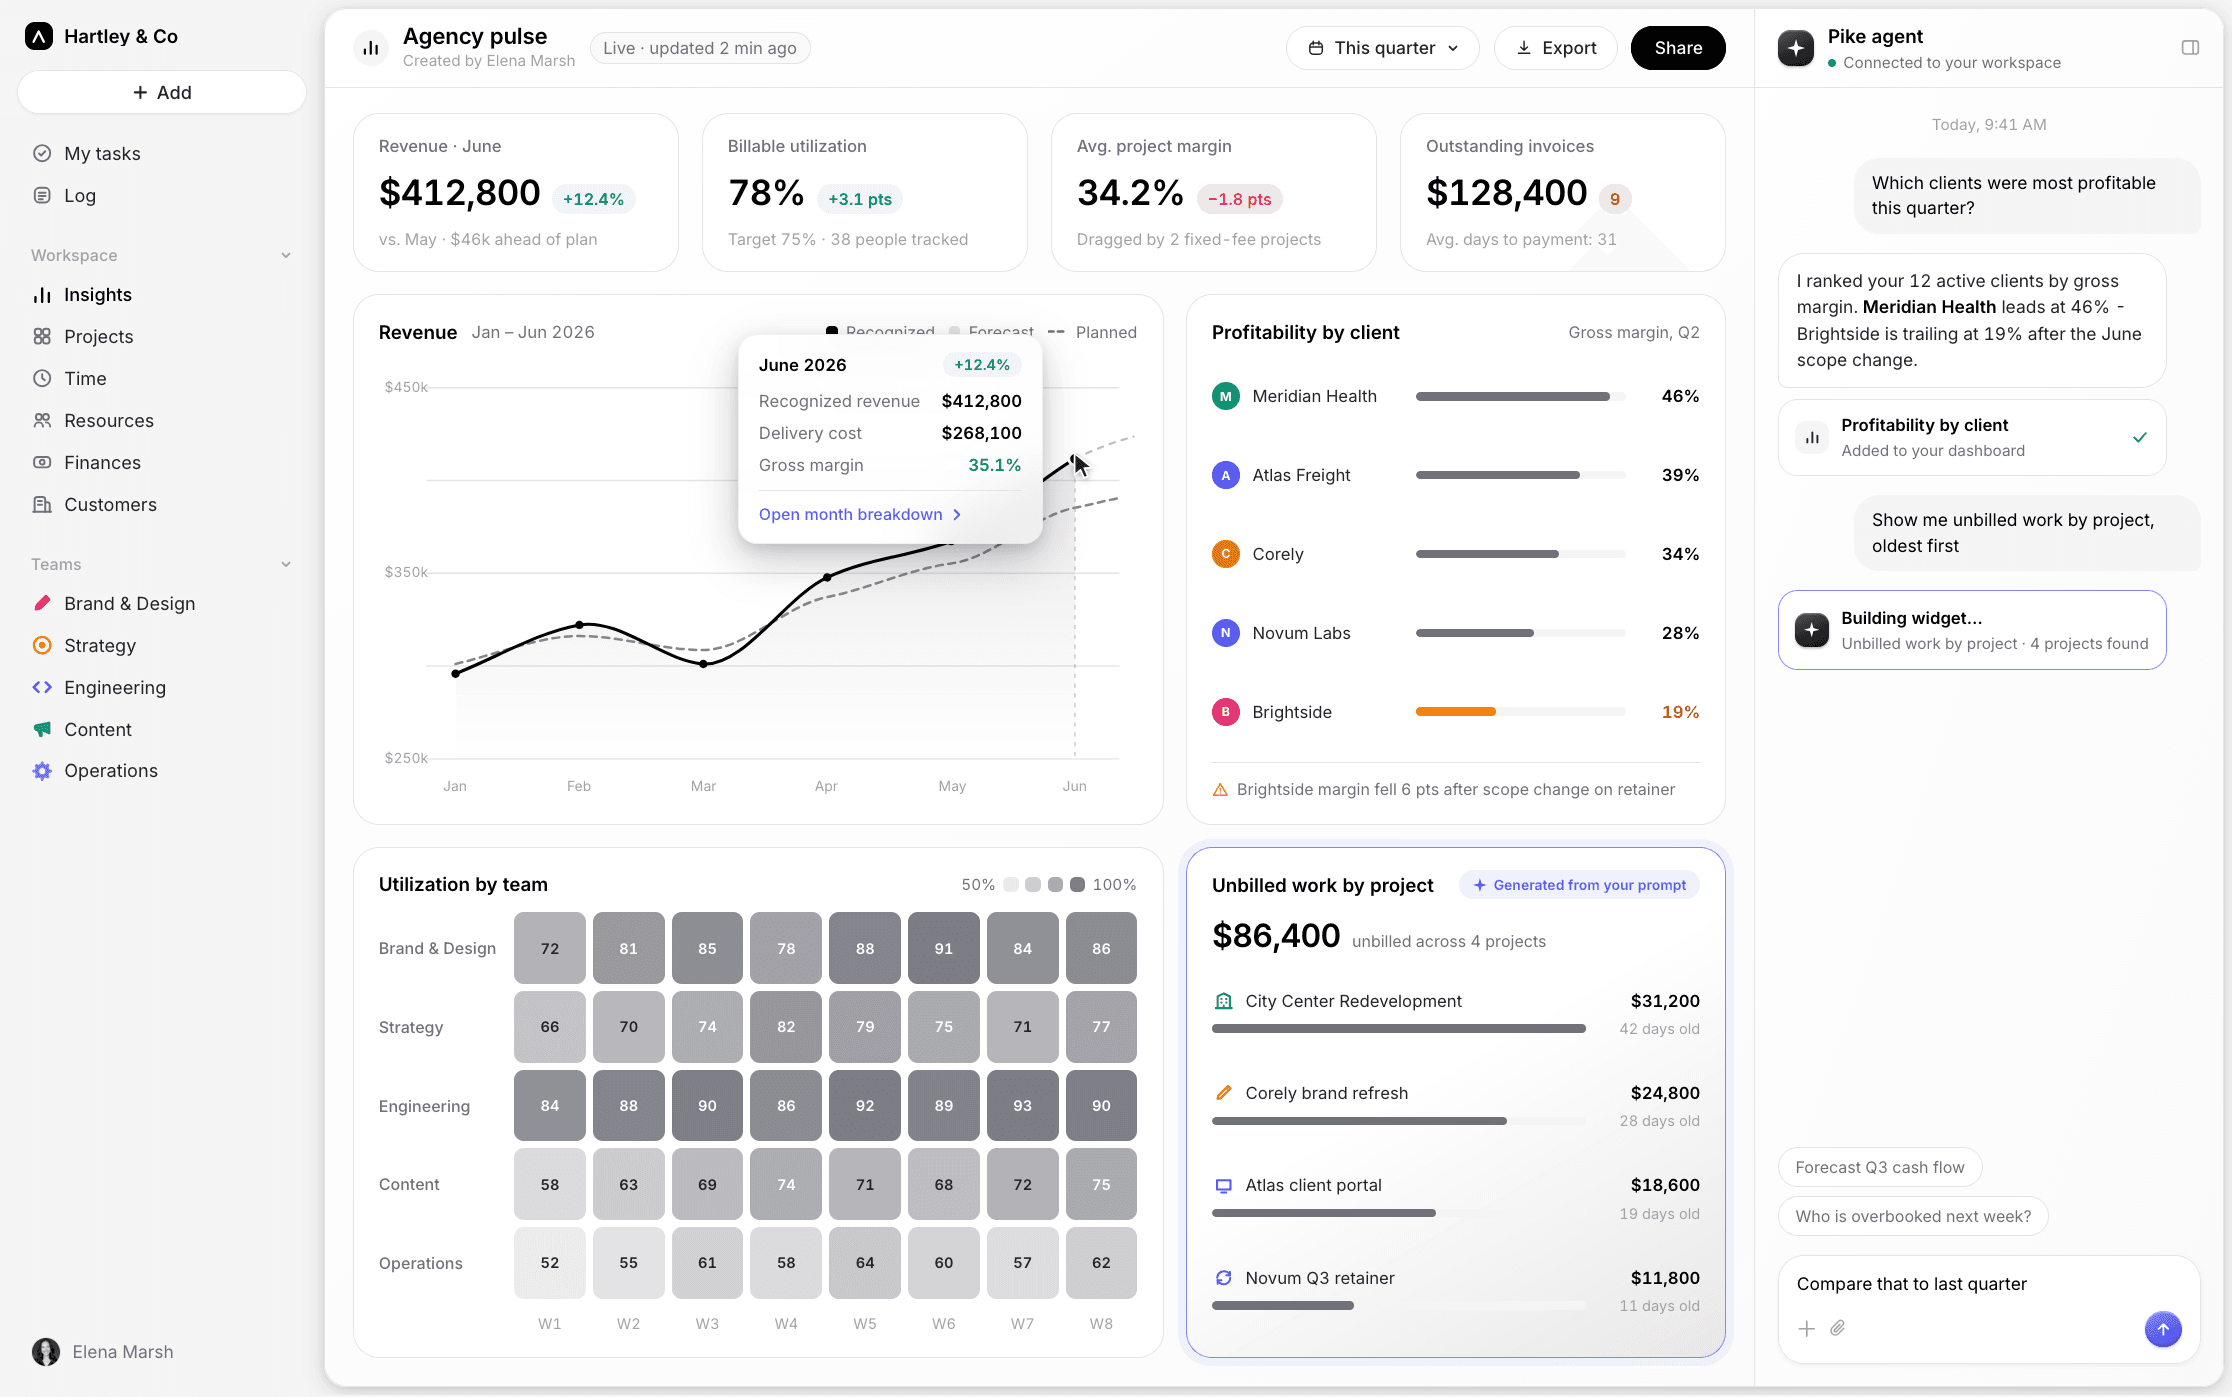
Pike connects logged time to cost rates and project budgets automatically, so margin updates as the team logs hours instead of waiting on a month-end export. The same live view underlies our broader guide to project profitability, and if you're comparing tools that surface this kind of visibility, our roundup of project financial management software covers what to look for beyond Pike. See the finance feature page for how the margin view works, or book a 15-minute walkthrough to see your own projects' real-time margin.
Frequently asked questions
Share