


Custom dashboards
Build a widget by asking
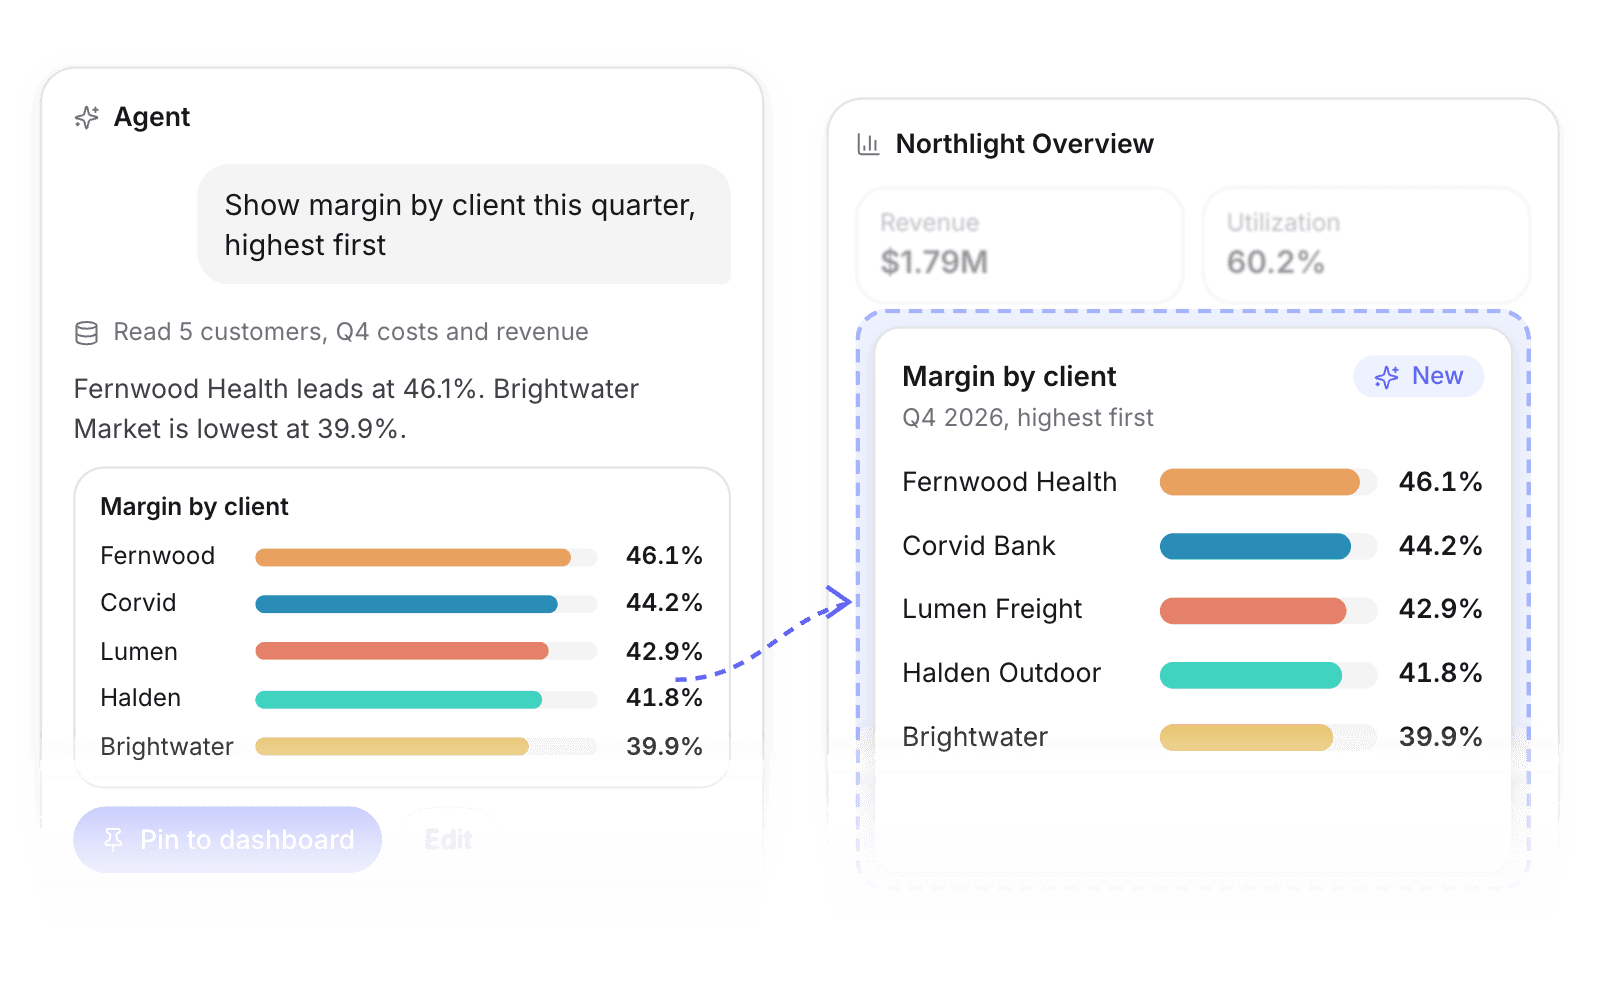
Tell the agent what you want to see. It builds the widget.
The agent reads your live data and pins the chart to your dashboard.

Product · Dashboards
Utilisation, margin, pipeline, and hours move as work happens. Describe the view you want and the agent builds it.
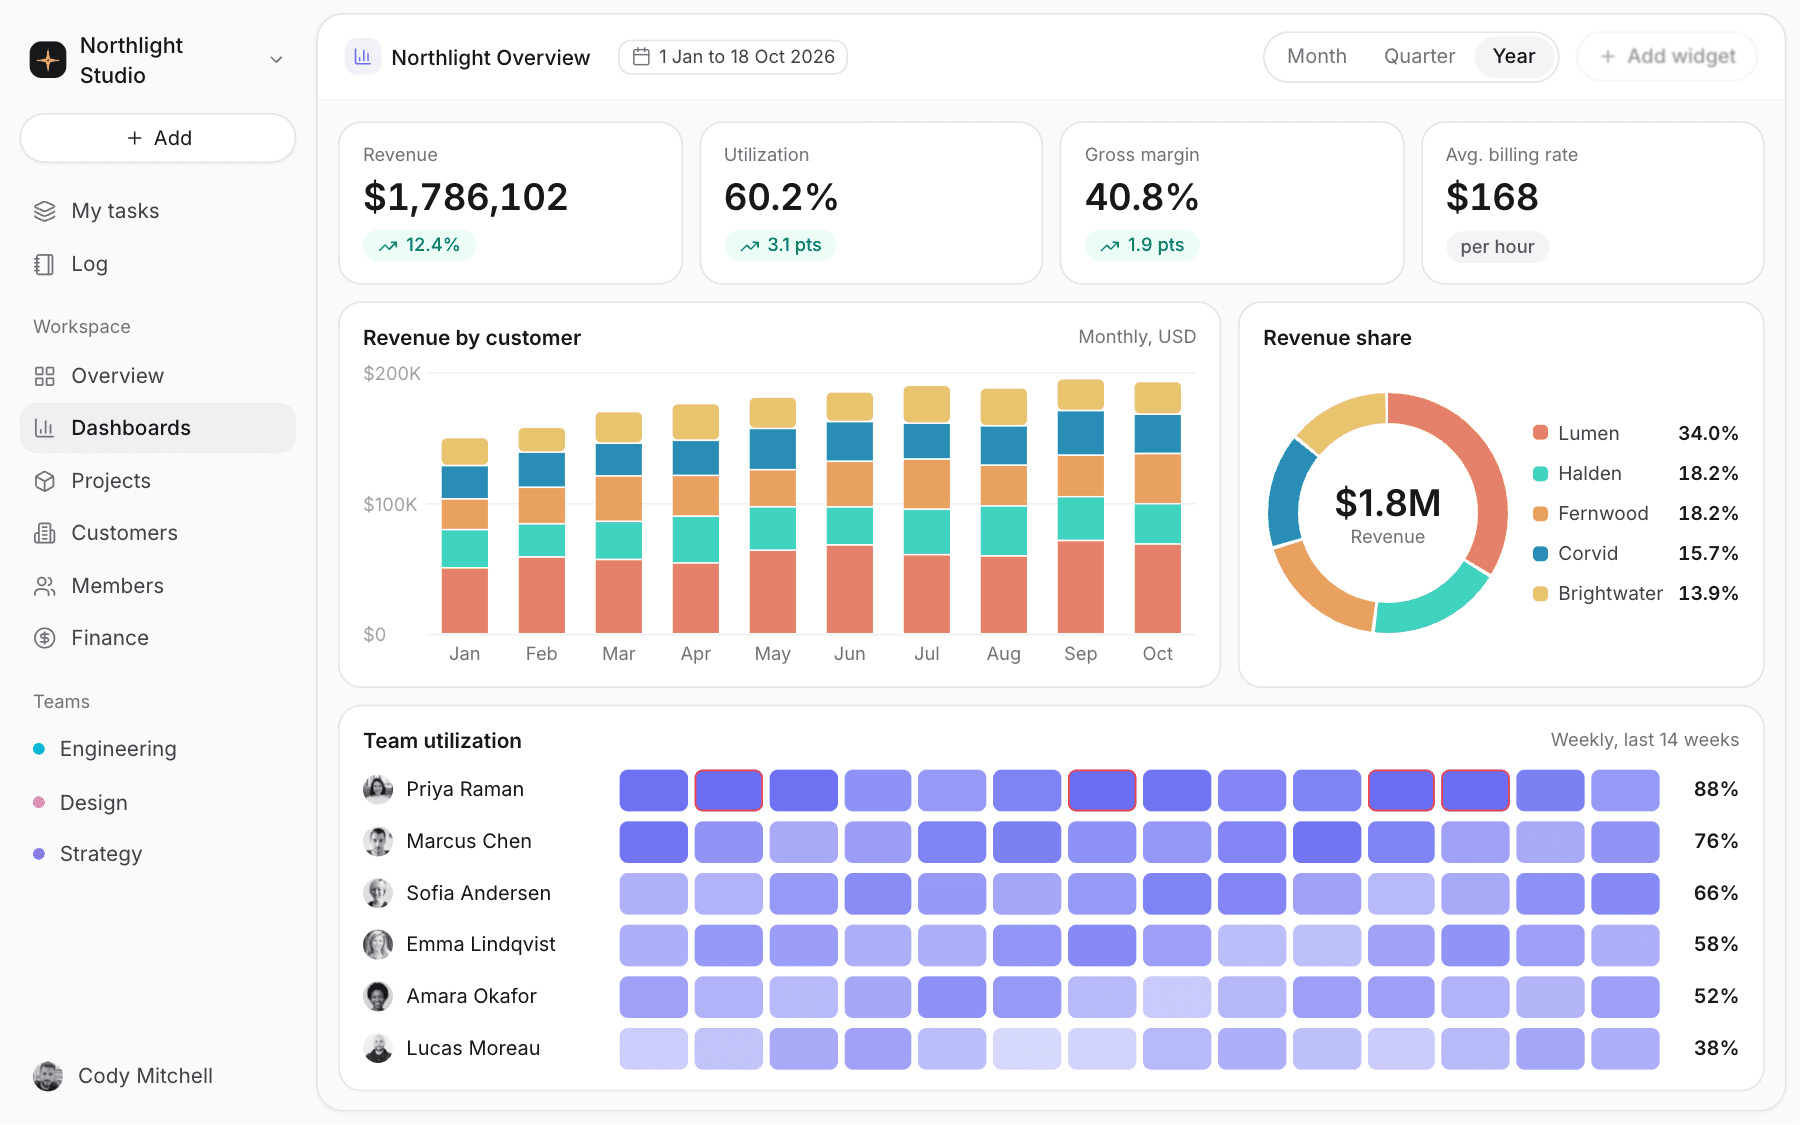
Custom dashboards
Tell the agent what you want to see. It builds the widget.
The agent reads your live data and pins the chart to your dashboard.
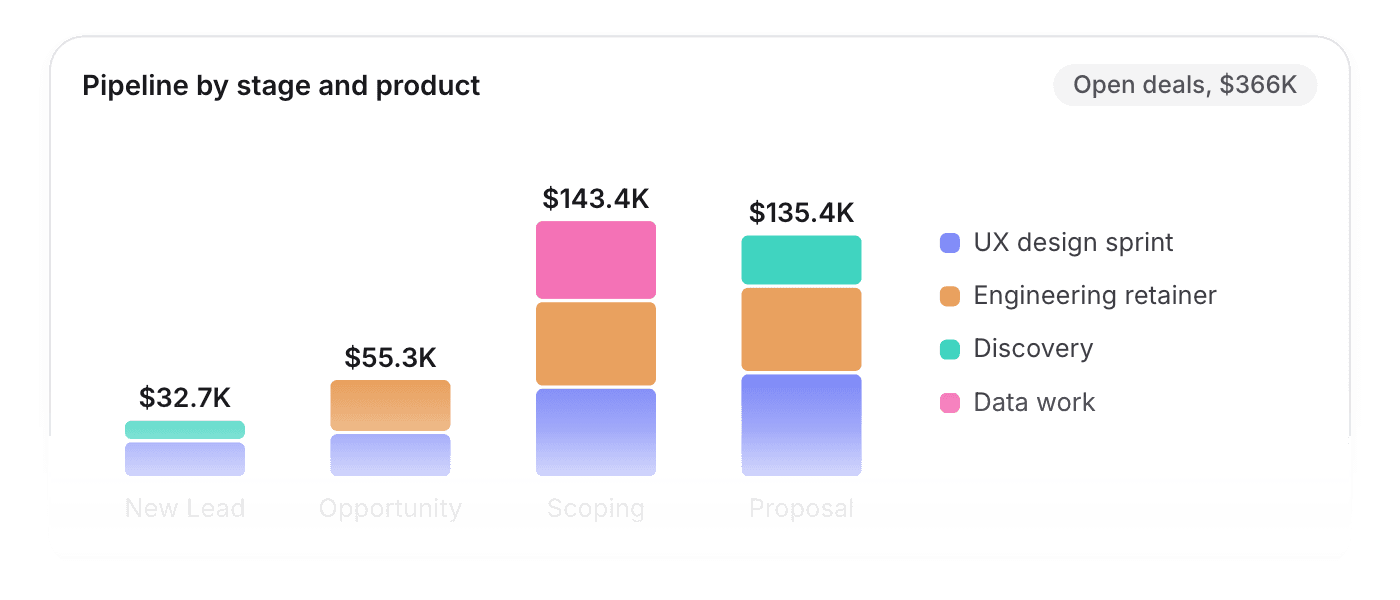
Deal value at every stage, broken down by the services and products inside each deal.
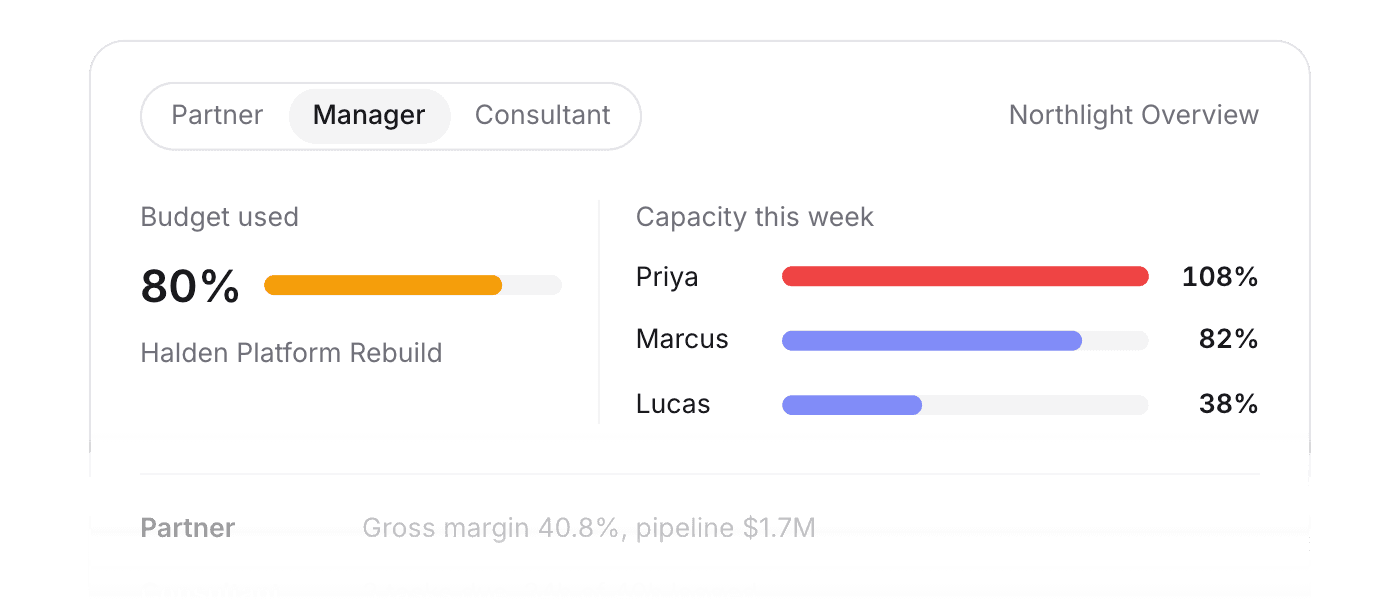
Partners open margin and pipeline. Managers open budgets and capacity. Consultants open their tasks.
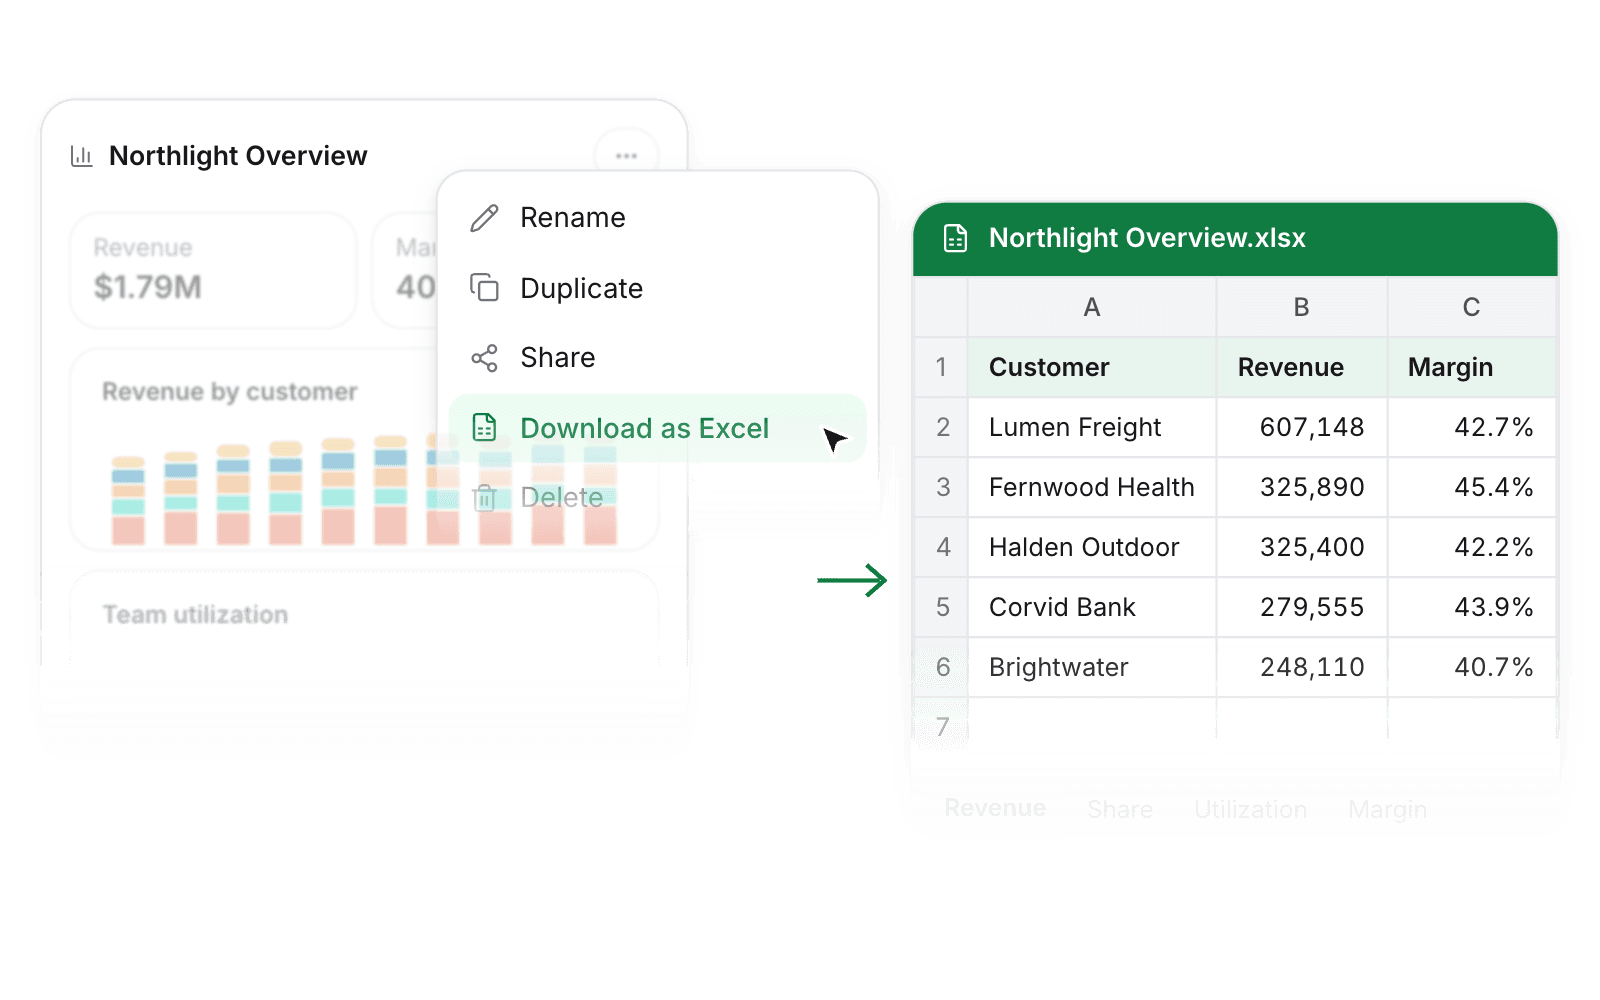
Export to Excel
Every widget becomes its own sheet, ready to share or slice further.
One click sends the whole dashboard to Excel, one sheet per widget, scoped to the date range you're viewing.
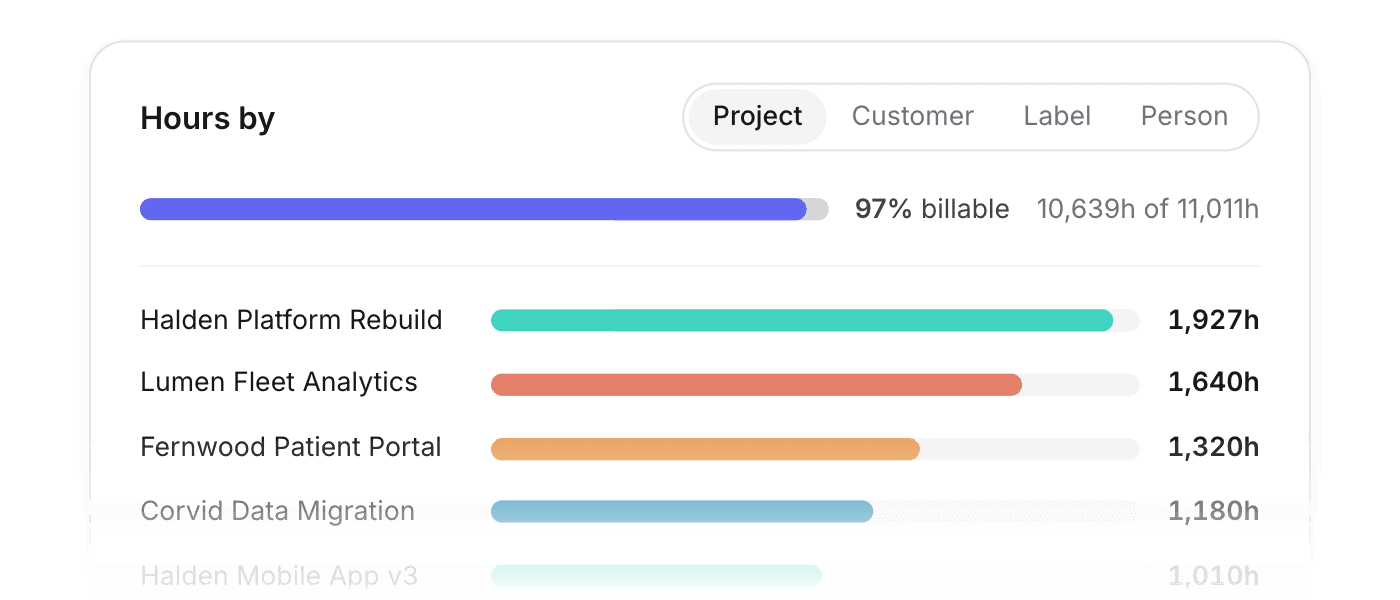
Time by project, customer, label, or person, with the billable split sitting beside it.
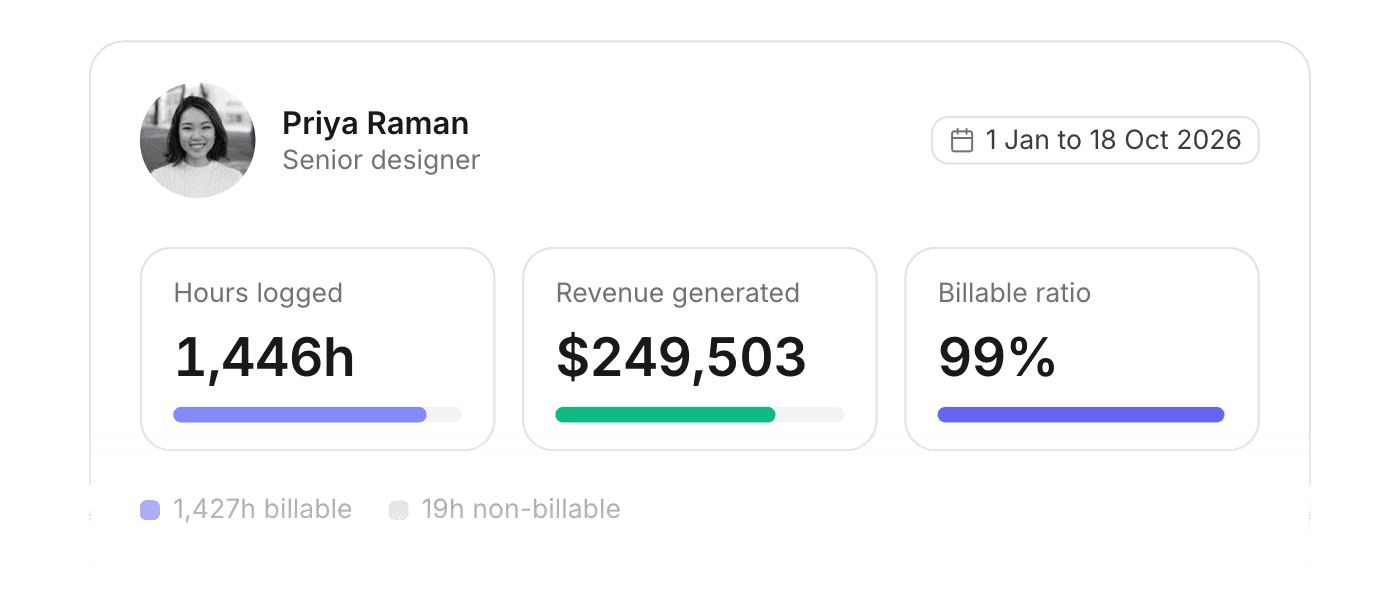
Hours logged, revenue generated, and billable ratio, for any period you choose.
Want the details? Read the full docs
 Finance & invoicing
Live margin by client, project, and team, with invoices that flow to your bookkeeping.
 Time & absence
Timers, one-click logging, and approvals, with every hour priced into project financials.
 Resourcing & capacity
See capacity at a glance, soft-book tentative work, and staff roles with placeholders.
 Projects
Board, list, and timeline views with milestones, dependencies, and templates.
 Customers & sales
Deals convert to projects, with pipeline, delivery, and profitability per customer.
 Pike MCP
Ask Claude or ChatGPT about margin and status, and create projects from the chat.
 ISO 27001
 GDPR
 SOC 2 Type II
Built to keep sensitive client data secure and private.