


Marketing agency profitability: how to measure it and where it leaks
 Daniel Reyes
By Daniel Reyes
Content Writer at Pike
Share

Most finance teams can work out what a project earned after it closed. With a good project profitability report, you can see which projects are losing margin while there is still budget left to change course. The difference comes down to which columns you put in the report and how often you fill it in.
A project profitability report is a table with one row per active project, showing revenue, delivery cost and margin for the period, next to budget used and work completed. Read side by side, those columns let you sort projects into on track, drifting and needing a decision this week.
This guide covers the columns to include, a filled-in example, a layout you can copy into a spreadsheet, and how to read the numbers once you have them. For the formula and which costs belong in it, see the project profitability guide.
A project profitability report shows, for each project, how much it has earned, what it has cost to deliver and the margin between the two. A useful version also shows progress, because you cannot judge the margin on a half-finished project without knowing how far along it is.
Take a fixed-fee project at 35% margin. With 90% of the work done, 35% is a good result. With 40% of the work done and 80% of the budget spent, the same 35% is about to fall. Nobody can tell those two projects apart unless both numbers sit on the same row.
Include eight columns. Fewer and you lose the comparison between spend and progress. More and people stop reading the report.
| Column | What it holds | Where the number comes from |
|---|---|---|
| Project | Client and project name | Project list |
| Billing type | Fixed fee, time and materials, capped, or retainer | Contract or SOW |
| Revenue | Earned revenue for the period | Invoices, or hours × sell rate for unbilled work |
| Delivery cost | Hours × each person's cost rate, plus project expenses | Timesheets, cost rates, expense log |
| Margin % | (Revenue − delivery cost) ÷ revenue | Calculated |
| Budget used % | Spend to date ÷ total budget | Calculated |
| Work done % | Share of scope or milestones complete | Project manager's estimate |
| Effective rate | Revenue ÷ hours logged | Calculated |
Two of these columns deserve extra care. Delivery cost should use each person's real cost rate, worked out from salary and contracted hours, not an average for the whole team. With an average, you cannot see the difference between a project staffed by senior people and one staffed by juniors. Work done % is a judgement call, and that is fine: an honest estimate from the project manager is far more useful than a blank cell.
Here is the report for a team with five active projects in October. The numbers are fictional, but the patterns are common.
| Project | Billing | Revenue | Delivery cost | Margin | Budget used | Work done |
|---|---|---|---|---|---|---|
| Northwind rebrand | Fixed fee | $32,000 | $25,920 | 19.0% | 81% | 60% |
| Harbor app | T&M | $41,600 | $24,960 | 40.0% | 52% | 55% |
| Elm Co. retainer | Retainer | $18,000 | $13,140 | 27.0% | 94% | n/a |
| Bluefin site | Capped T&M | $16,800 | $9,240 | 45.0% | 40% | 45% |
| Quarry audit | Fixed fee | $10,000 | $5,800 | 42.0% | 30% | 35% |
| Total | $118,400 | $79,060 | 33.2% |
The totals look healthy: $118,400 in revenue, $79,060 in delivery cost and 33.2% margin across the business. Three of the rows are more useful to read than the total.
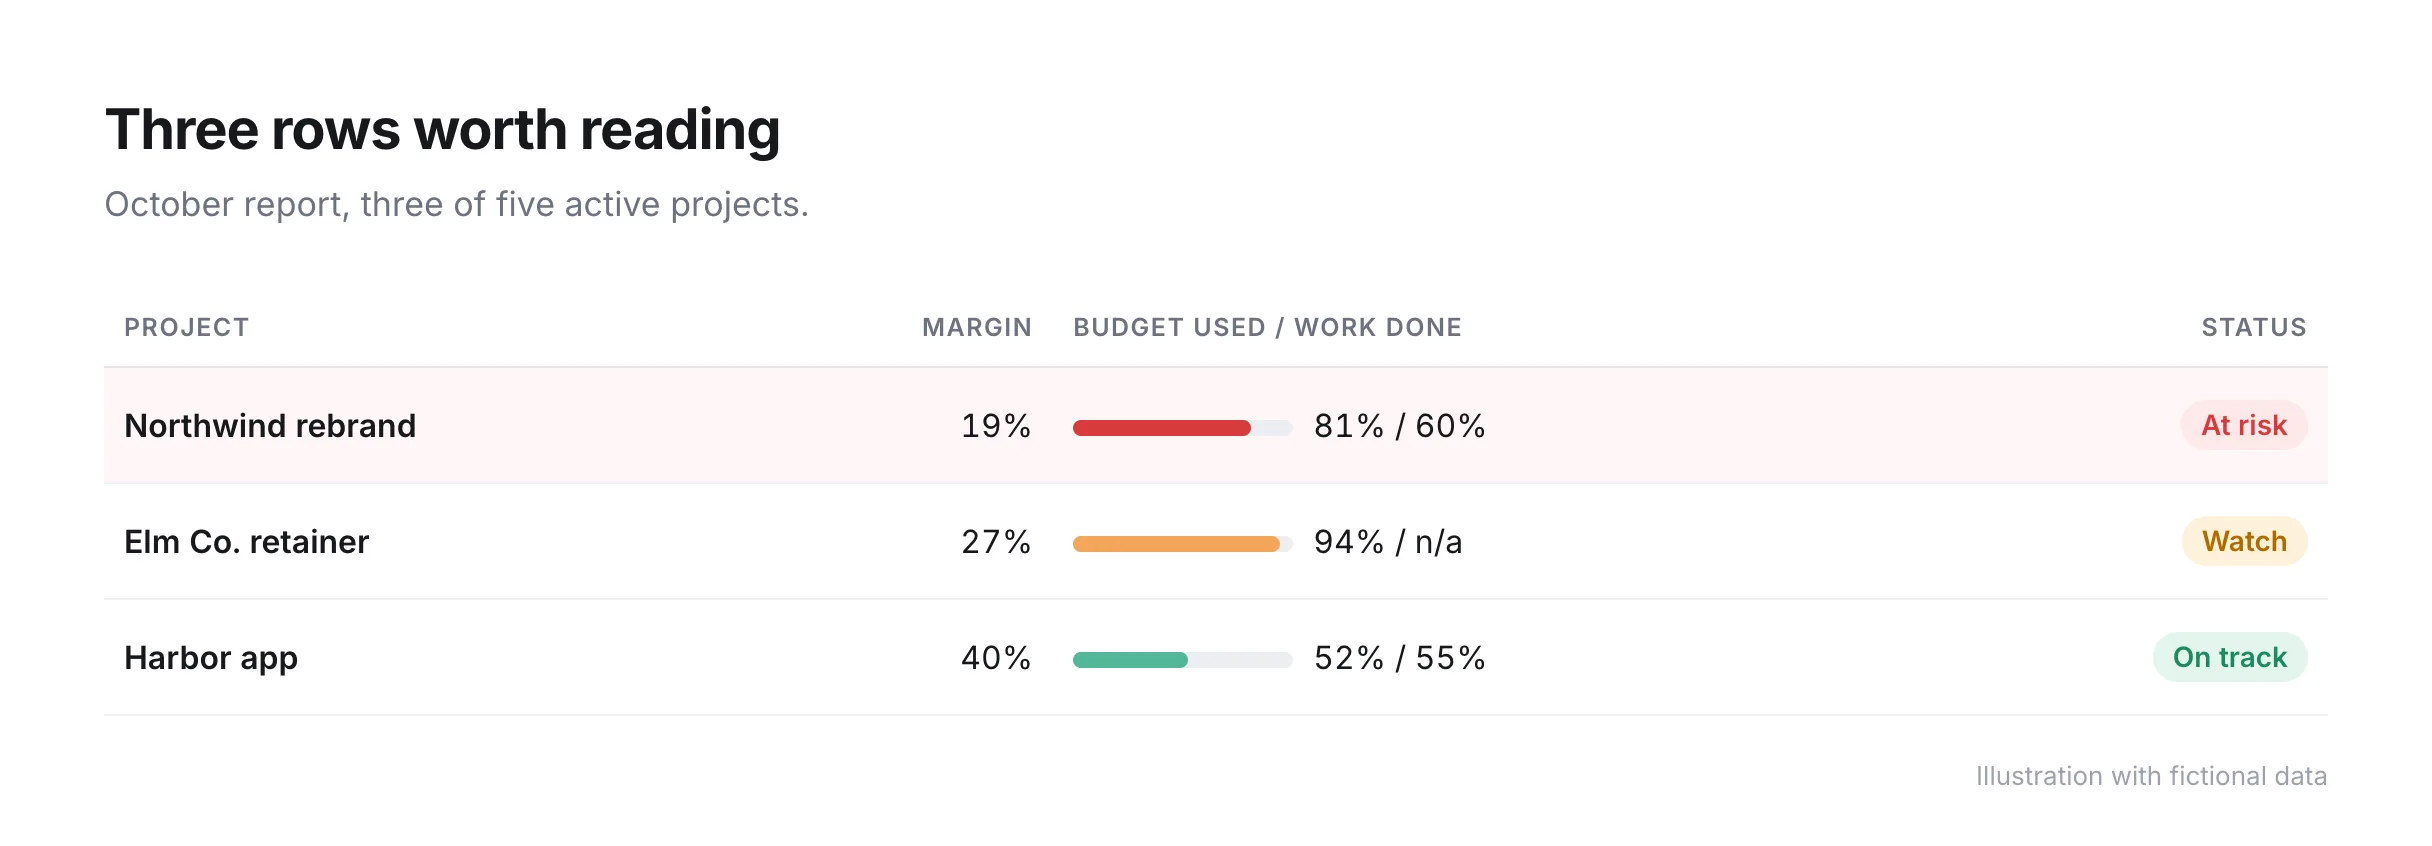
Northwind rebrand has used 81% of its budget with 60% of the work done. On a fixed fee, every extra hour comes out of margin, and at the current rate the project will run out of budget before the work is finished. Margin is already down to 19%. The project manager and account owner should talk to the client this week, either about scope or about a change order.
Elm Co. retainer has used 94% of this month's allowance. Margin is 27%, below the 30% target. The question for the account owner is whether the client is asking for more than the retainer covers, which is a pricing question for the next renewal.
Harbor app is time and materials with 52% of budget used and 55% of work done. Spend and progress move together, and the client pays for every hour. Nobody needs to act on this one.
Compare budget used with work done on every fixed-fee and capped project. When budget used runs more than 10 to 15 points ahead of work done, the project is likely to finish over budget unless the team changes something.
| Budget used vs work done | What it usually means | What to do |
|---|---|---|
| Roughly equal | Project is on plan | Nothing |
| Budget ahead by 10+ points | Estimate was low, or scope has grown | Check for unbilled scope, then raise a change order or re-plan |
| Work ahead by 10+ points | Team is faster than estimated, or work done is overstated | Confirm the estimate with the project manager |
| Budget near 100%, work well short | Project will run over | Decide now: change order, scope cut, or accept the loss |
Time-and-materials projects need a different check. Revenue rises with every hour logged, which means margin depends on the effective rate. Watch for an effective rate falling below the agreed sell rate, which happens when the team logs hours that the client will not be billed for, or when write-offs creep in at invoice time.
Most teams need both, read by different people. The portfolio report is one row per project and goes to leadership and finance every week or month. The single-project report breaks one project down by phase, person or task, and goes to the project manager who has to act on it.
| Portfolio report | Single-project report | |
|---|---|---|
| Rows | One per project | One per phase, task or person |
| Reader | Founders, finance, delivery leads | Project manager, account owner |
| Question | Which projects need attention? | Where inside this project is the money going? |
| Cadence | Weekly or monthly | Weekly while the project runs |
Start with the portfolio report. When a row turns red, open the single-project view for that project only.
A report is a snapshot for a fixed period that someone reviews and signs off. A dashboard is the same data, kept current, that anyone can open at any time. Most teams start with a monthly report in a spreadsheet and move to a dashboard once the monthly version is too late to act on.
The trade-off is effort. A spreadsheet report takes a few hours each month to compile from timesheets, invoices and payroll. A dashboard in a tool that already holds time, rates and invoices updates as people log hours, and nobody has to compile it.
You can build a working version in Excel or Google Sheets with three tabs:
SUMIFS on the project name, then calculate margin, budget used and effective rate.Add conditional formatting to the budget used column: red when it runs more than 15 points ahead of work done, amber at 10. With that one rule, you can read the table as a list of projects to discuss.
The weak points of the spreadsheet version are the inputs. Cost rates change when people get raises, timesheets arrive late, and someone has to re-export the invoices every month. If the report is regularly a week late or nobody trusts the cost column, the spreadsheet has reached its limit.
Professional services automation (PSA) tools calculate the report from data they already store: logged hours, cost rates, budgets and invoices. The layouts differ, but most put planned or quoted figures next to actuals.
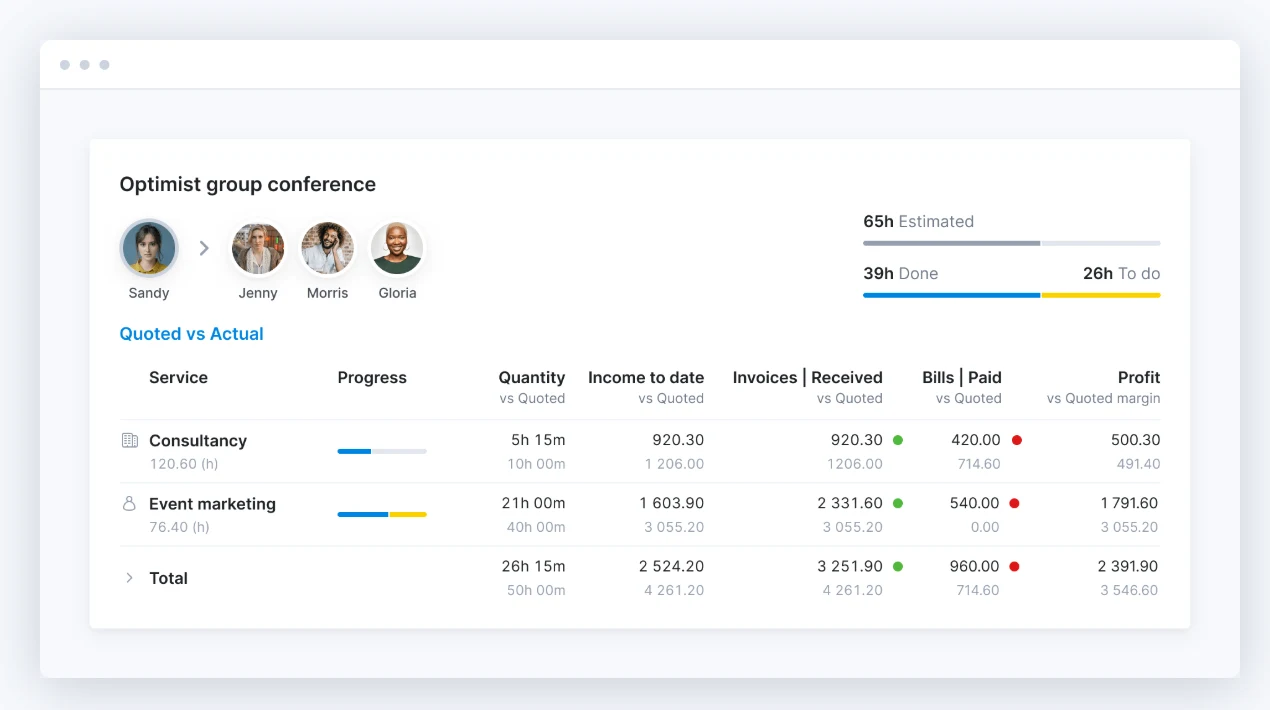
Scoro's quoted vs actual view, from scoro.com/roles/finance. Each service line has quoted and actual figures for hours, income, invoices, bills and profit.
Scoro's project view puts each service next to what was quoted, which works well for the single-project report: you can see which service line is losing margin.
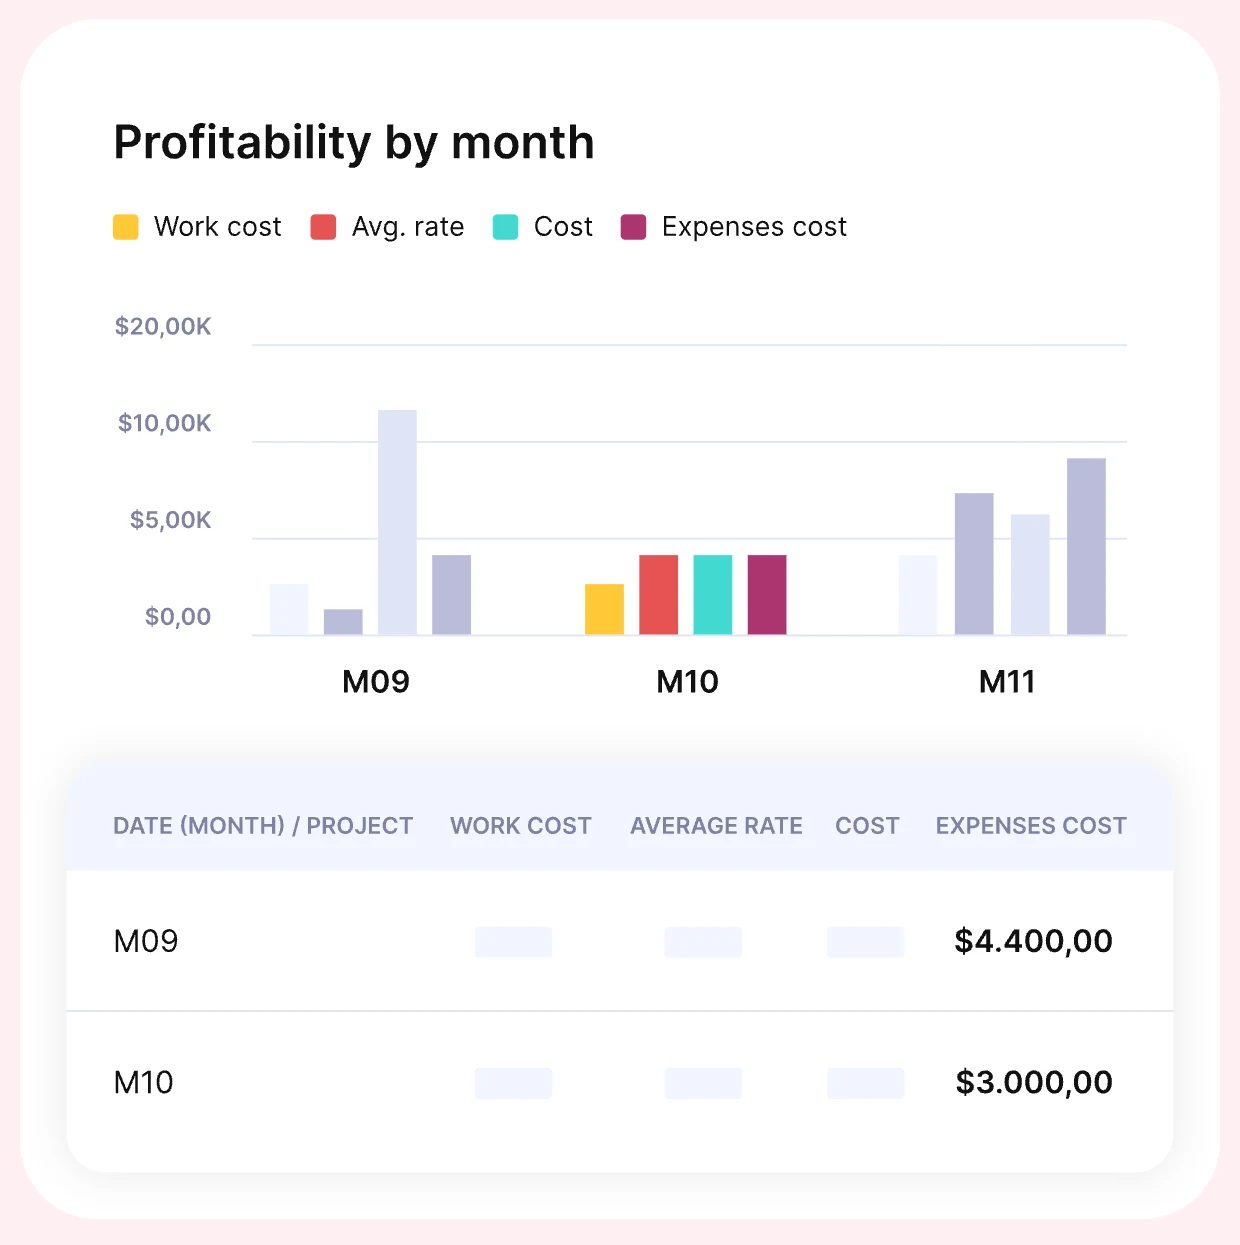
Productive's profitability by month illustration, from productive.io/profitability. Cost categories by month, with a table underneath.
Productive groups profitability by month, which suits the portfolio view and month-end reviews.
In Pike, the finance features show planned and actual earnings, cost and profit by month for every project. Allocations are the plan, and logged hours and invoices are the actuals. Each person's cost per hour comes from their salary and contracted hours, and raises apply from their start date, which keeps past margins accurate. You can also set a project budget and cost budgets per category and track spend against them while the work runs.
To test the numbers for one project first, the free project margin calculator calculates margin from revenue, hours and cost rates. For the habit of reading margin while projects run, see real-time project profitability.
See which of your projects are profitable this week, not at month-end: book a 15-minute walkthrough.
Include project, billing type, revenue, delivery cost, margin %, budget used %, work done % and effective rate. Most reports leave out the comparison between budget used and work done, and that pair of columns is where you spot a fixed-fee project about to go over.
Subtract delivery cost from revenue, then divide by revenue. Delivery cost is hours logged multiplied by each person's cost rate, plus any project expenses. For example, $32,000 revenue and $25,920 delivery cost gives a margin of 19%.
Run the portfolio report monthly at minimum and weekly for teams with many fixed-fee projects. Weekly reviews give project managers time to raise a change order before the budget runs out. With monthly reviews, teams often find the problem after the money is spent.
You can build one with three tabs: inputs per project, time and cost per timesheet entry, and a report tab that uses SUMIFS to total cost by project. The column list in this guide works as the header row for the report tab.
A report is a fixed snapshot for a period, compiled and reviewed on a schedule. A dashboard holds the same columns but updates as people log time and send invoices. Teams usually move from a report to a dashboard once a monthly report arrives too late to act on.
Share
 ISO 27001
 GDPR
 SOC 2 Type II
Built to keep sensitive client data secure and private.