


Bench time: cost and how to reduce it
 Clara Jensen

By Rebecca Shaw
Content Writer at Pike
Share
"I need to see which consultants are available before I commit them to new projects. What resource utilization tools give instant visibility into team capacity and skills?" Agencies ask that question when the utilization number arrives once a month in a spreadsheet, two weeks after the hours it describes. Resource utilization software calculates the number continuously from time entries and allocations, per person and per team, so a low or overloaded month shows while it can still be changed.
This guide compares nine tools on that one job: measuring utilization and making it usable. Our capacity planning software guide covers whether the team has enough hours for the work ahead, and our resource scheduling software guide covers who works on what on which day.
Resource utilization software measures the share of each person's available hours that goes to billable work, and reports it for any person, team, role, or period. The utilization rate formula is billable hours divided by available hours. The software's job is to keep both halves of that formula current without anyone building a spreadsheet.
Two versions of the number matter, and a useful tool shows both:
Planned utilization is the one you can still act on. A person planned at 55% for next month can be staffed onto something. A person planned at 115% needs work moved before the month starts.
Capacity planning and scheduling tools use the same underlying data for different questions. Capacity planning asks whether total hours cover total demand. Scheduling places a person on a task on a date. Utilization software asks how much of the available time was, or will be, billable.
| What to check | Why it matters for utilization |
|---|---|
| Billable and non-billable split | Total hours logged can look healthy while billable hours fall |
| Available hours net of time off | Utilization is overstated or understated if leave and holidays are not removed from the denominator |
| Planned and actual in one report | Actual explains the past and planned shows the weeks you can still change |
| Breakdown by role and team | An agency average hides one overloaded team and one idle one |
| Targets per role | A partner and a junior developer should not be measured against the same target |
| Flags for under- and over-booking | Someone has to notice a 50% month before it starts |
| Link to rates and cost | Utilization tied to billing shows revenue at stake, and tied to cost shows margin |
Ask each vendor to show the report with your own target per role and a month that includes leave. Those two details are where utilization reports most often turn out to be wrong.
Starting prices are the vendors' public list prices as of 2026. Where a vendor does not publish pricing, we show contact sales.
| Tool | Best for | Starting price | Utilization-specific feature |
|---|---|---|---|
| Pike | Agencies of 20 to 200 people | From $29/user/month | Utilization at 3 levels (project, team, person) from billed time |
| BigTime | Finance-led services firms | $20/person/month | Utilization from per-person cost rates, shown on heatmaps |
| Productive | Agencies tracking billable share closely | $9/person/month annually | Billable vs non-billable utilization against budgets |
| Pike Enterprise | Firms of 200+ and multi-entity groups | Custom, billed annually | Utilization across entities in one master workspace |
| Kantata | Large, multi-entity firms | Contact sales | Utilization reporting connected to project accounting |
| Scoro | Boutique consultancies | Contact sales | Logged hours flow into utilization reports automatically |
| Accelo | Client-services firms on one platform | Contact sales | Real-time reporting with AI-assisted workload forecasting |
| Rocketlane | Implementation and onboarding teams | Contact sales | Portfolio-level utilization across client projects |
| Teamwork | Collaboration-first agencies | Contact sales | Workload view per person, lighter utilization reporting |
| Asana | Teams that only need workload | $10.99/person/month annually | Workload view, no native utilization report |
Best for: agencies and consultancies that want utilization calculated from the same hours they invoice.
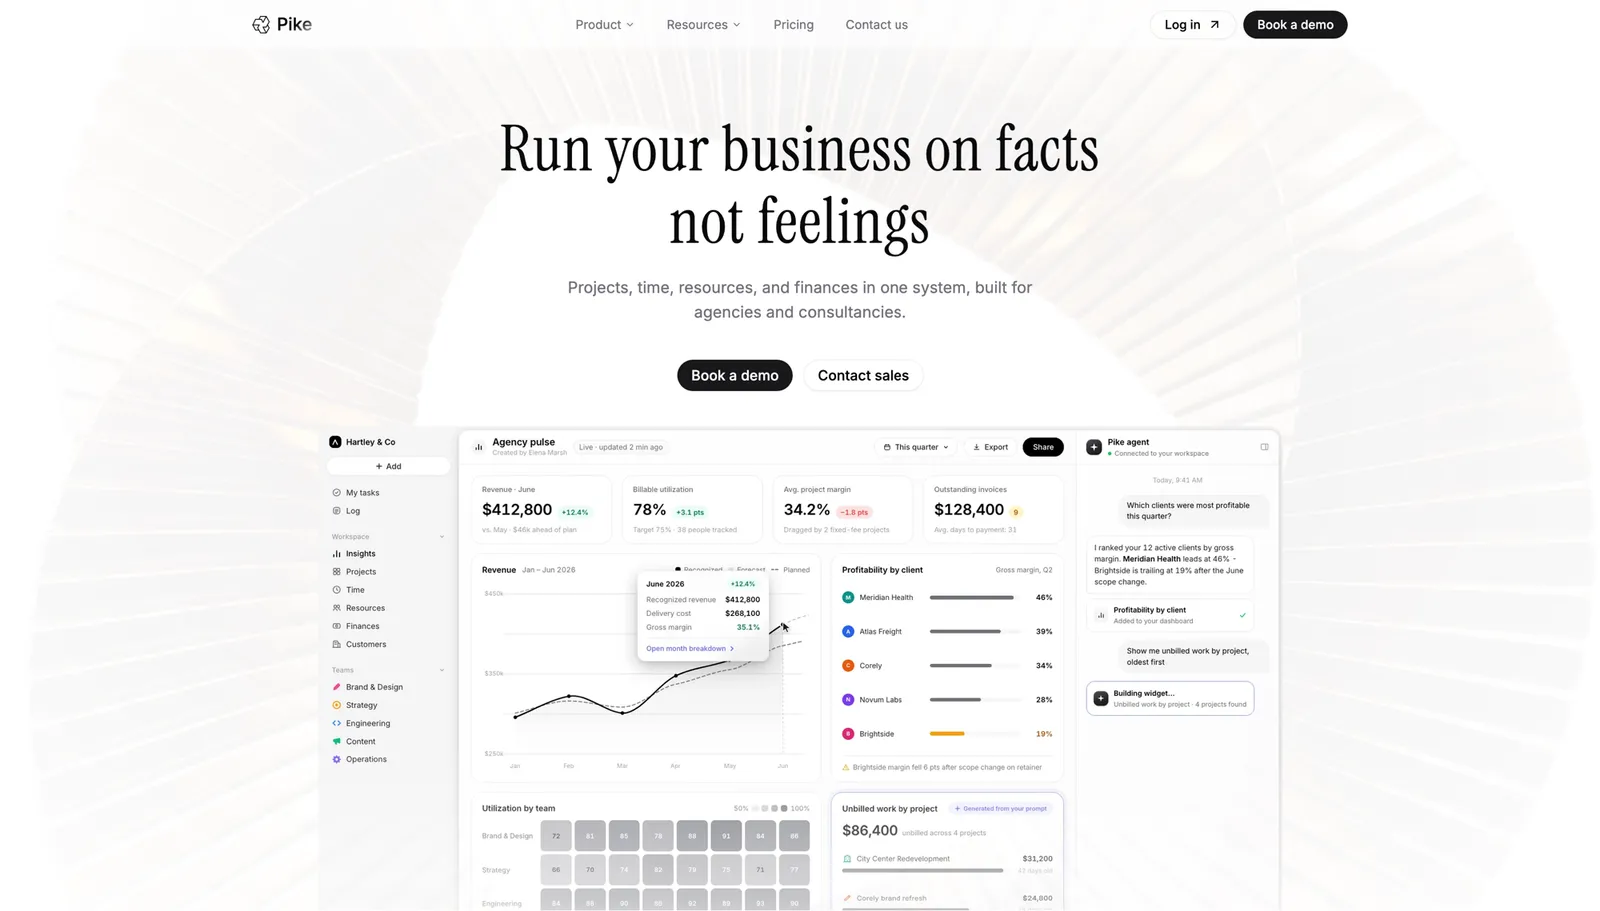
Pike reports utilization at 3 levels: by project, by team, and by person. The report covers any period from the coming day to a full year. The hours behind it are the time entries that are priced into project financials and sent to invoices, so the utilization figure and the billed revenue come from one set of data. Approved time off reduces available hours, which keeps the denominator correct in months with leave.
Planned utilization comes from allocations. A resource manager can see who is under-booked next month and change an allocation from the same view.
Strengths
Limitations
Pricing: Pike publishes plans starting at $29 per user per month (Core, billed annually; $35 monthly), with Growth at $49 and Scale at $99 per user per month, plus a custom Enterprise tier. See pricing.
Best for: finance-led professional services firms that want utilization expressed in cost and revenue.

BigTime calculates utilization from actual per-person cost rates, so the report shows what an under-used week costs as well as how many hours it involved. Color-coded heatmaps mark overbooked and under-used staff, and customizable dashboards compare billable with non-billable hours.
Strengths
Limitations
Pricing: BigTime starts at $20 per person per month. Confirm which tier includes heatmaps and utilization reporting.
Best for: agencies that manage to a billable-share target and want it next to project budgets.
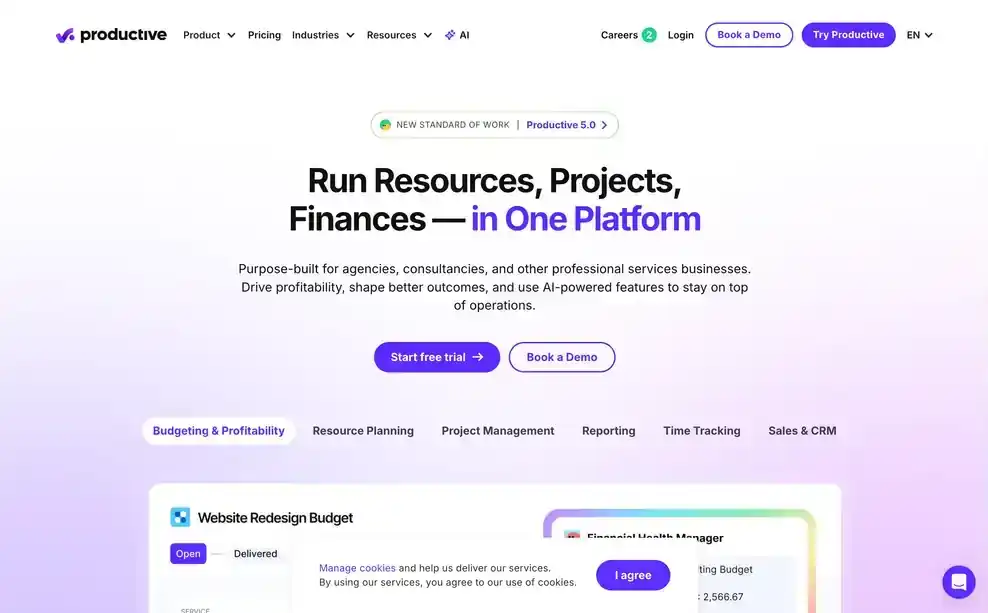
Productive monitors billable and non-billable utilization separately and compares assigned hours with each project's budget. Its availability forecast uses current workloads, project schedules, and time off, which gives a planned figure for the weeks ahead.
Strengths
Limitations
Pricing: Plans start at $9 per person per month billed annually. See Productive vs Pike.
Best for: large services firms that need utilization reported across offices and legal entities.
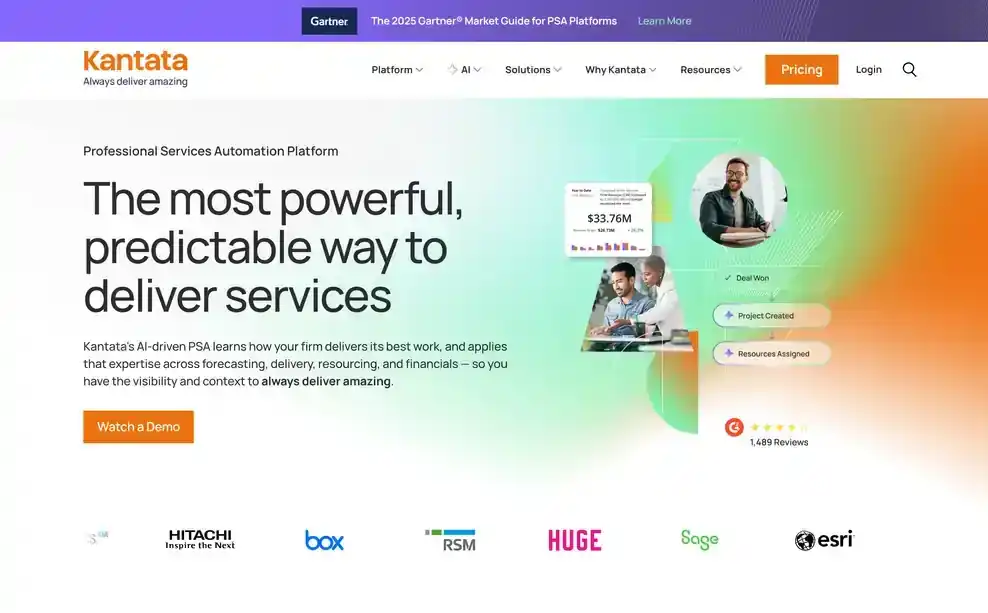
Kantata is a full professional services automation platform with strong forecasting and utilization reporting. Staffing decisions connect to utilization and to project accounting, and the Salesforce integration suits firms whose pipeline already lives in that CRM.
Strengths
Limitations
Pricing: Kantata does not publish standard pricing. Contact its sales team for a quote. See Kantata vs Pike.
Best for: boutique consultancies that want utilization reports without building them.
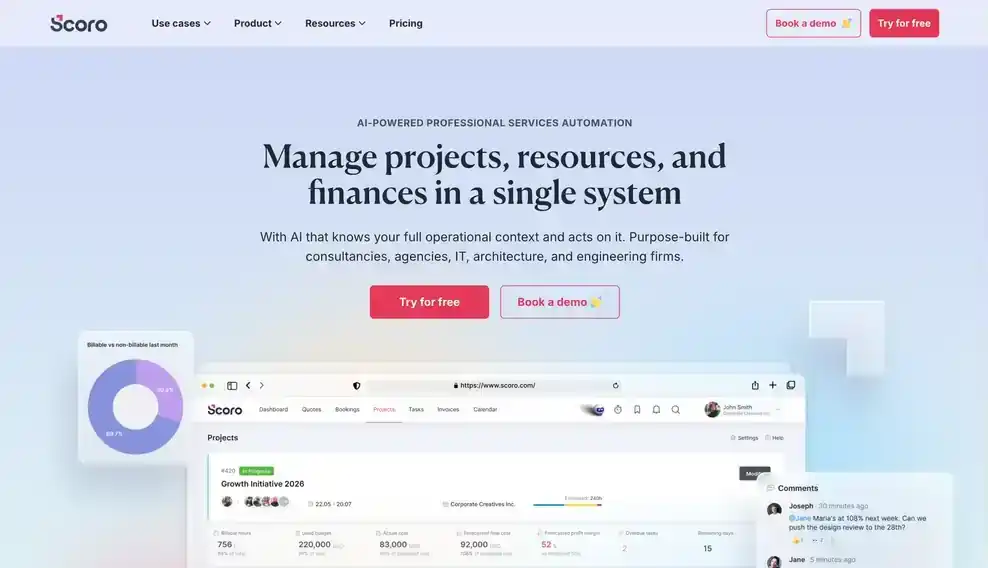
Hours logged in Scoro flow into project budgets, utilization reports, profitability dashboards, and invoicing automatically. The drag-and-drop Planner shows workloads and availability, so a planned over-booking is visible before the week starts.
Strengths
Limitations
Pricing: Scoro does not publish a verified public starting price for the tier that includes these features. Contact Scoro for current pricing. See Scoro vs Pike.
Best for: client-services firms that want utilization inside one platform covering sales through billing.

Accelo provides real-time reporting across the client lifecycle. It acquired Forecast in 2025, which brought AI-assisted capacity planning and workload forecasting into the platform. The predictive alerts flag likely workload problems ahead of time.
Strengths
Limitations
Pricing: Accelo does not publish pricing. Contact its sales team for a quote. See Accelo vs Pike.
Best for: implementation and onboarding teams that track utilization across a portfolio of client projects.

Rocketlane is built for professional services teams with 50 to 500 or more billable consultants, mainly in IT services, consulting, and SaaS implementation. It reports utilization at portfolio level and uses AI to turn a signed statement of work into a staffed project plan.
Strengths
Limitations
Pricing: Rocketlane does not publish a verified starting price. Contact sales for current pricing.
Best for: agencies that put client collaboration first and need a basic view of workload.
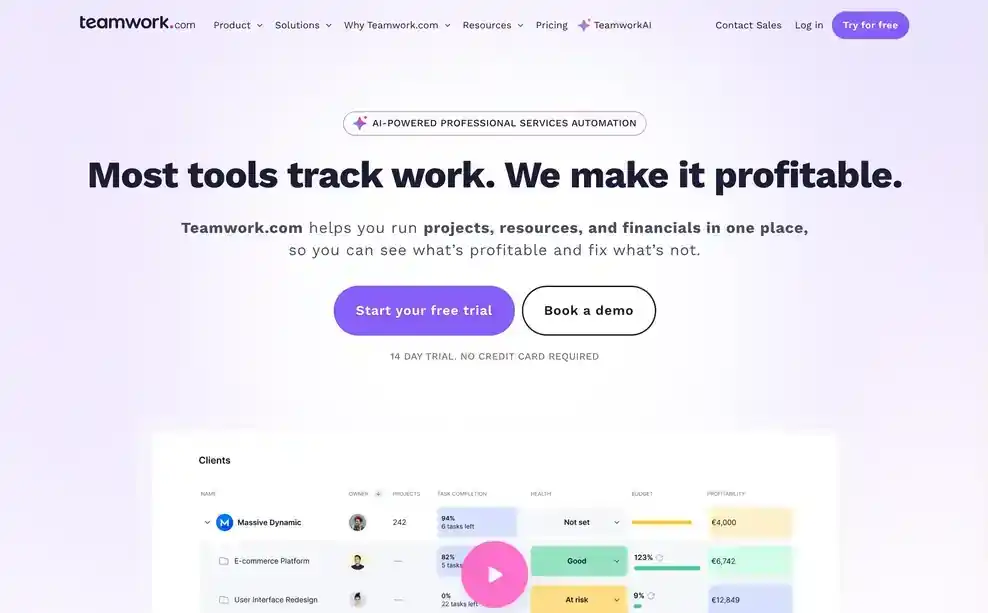
Teamwork's workload views show who is assigned to what, and its library of more than 150 integrations moves that data to other tools. Resource utilization is not handled at the depth a growing agency eventually needs, and teams commonly keep a second tool for financial reporting.
Strengths
Limitations
Pricing: Contact Teamwork for pricing that includes workload features. See Teamwork vs Pike.
Best for: teams that need to see workload and do not report utilization.
Asana's workload and timeline views show assignments across projects, and custom fields can hold effort estimates. Asana has no native utilization report, so the figure has to be calculated outside the tool, and utilization is not connected to project financials.
Strengths
Limitations
Pricing: Plans with basic timeline and workload features start at $10.99 per person per month billed annually. See Asana vs Pike.
Our guide to billable utilization rate covers how to set targets per role once the tool is in place.
We assessed each product against the seven checks in the table above, with most weight on the billable and non-billable split, planned and actual utilization in one report, and the link to rates and cost.
Feature and pricing details come from public vendor pages. Where a vendor does not publish pricing, we marked it contact sales. Each entry lists limitations next to its strengths, including Pike's.
To see utilization by person, team, and project for your own agency, book a 15-minute walkthrough. The resource management feature page shows the report.
Share
More in the same topic
 ISO 27001
 GDPR
 SOC 2 Type II
Built to keep sensitive client data secure and private.